

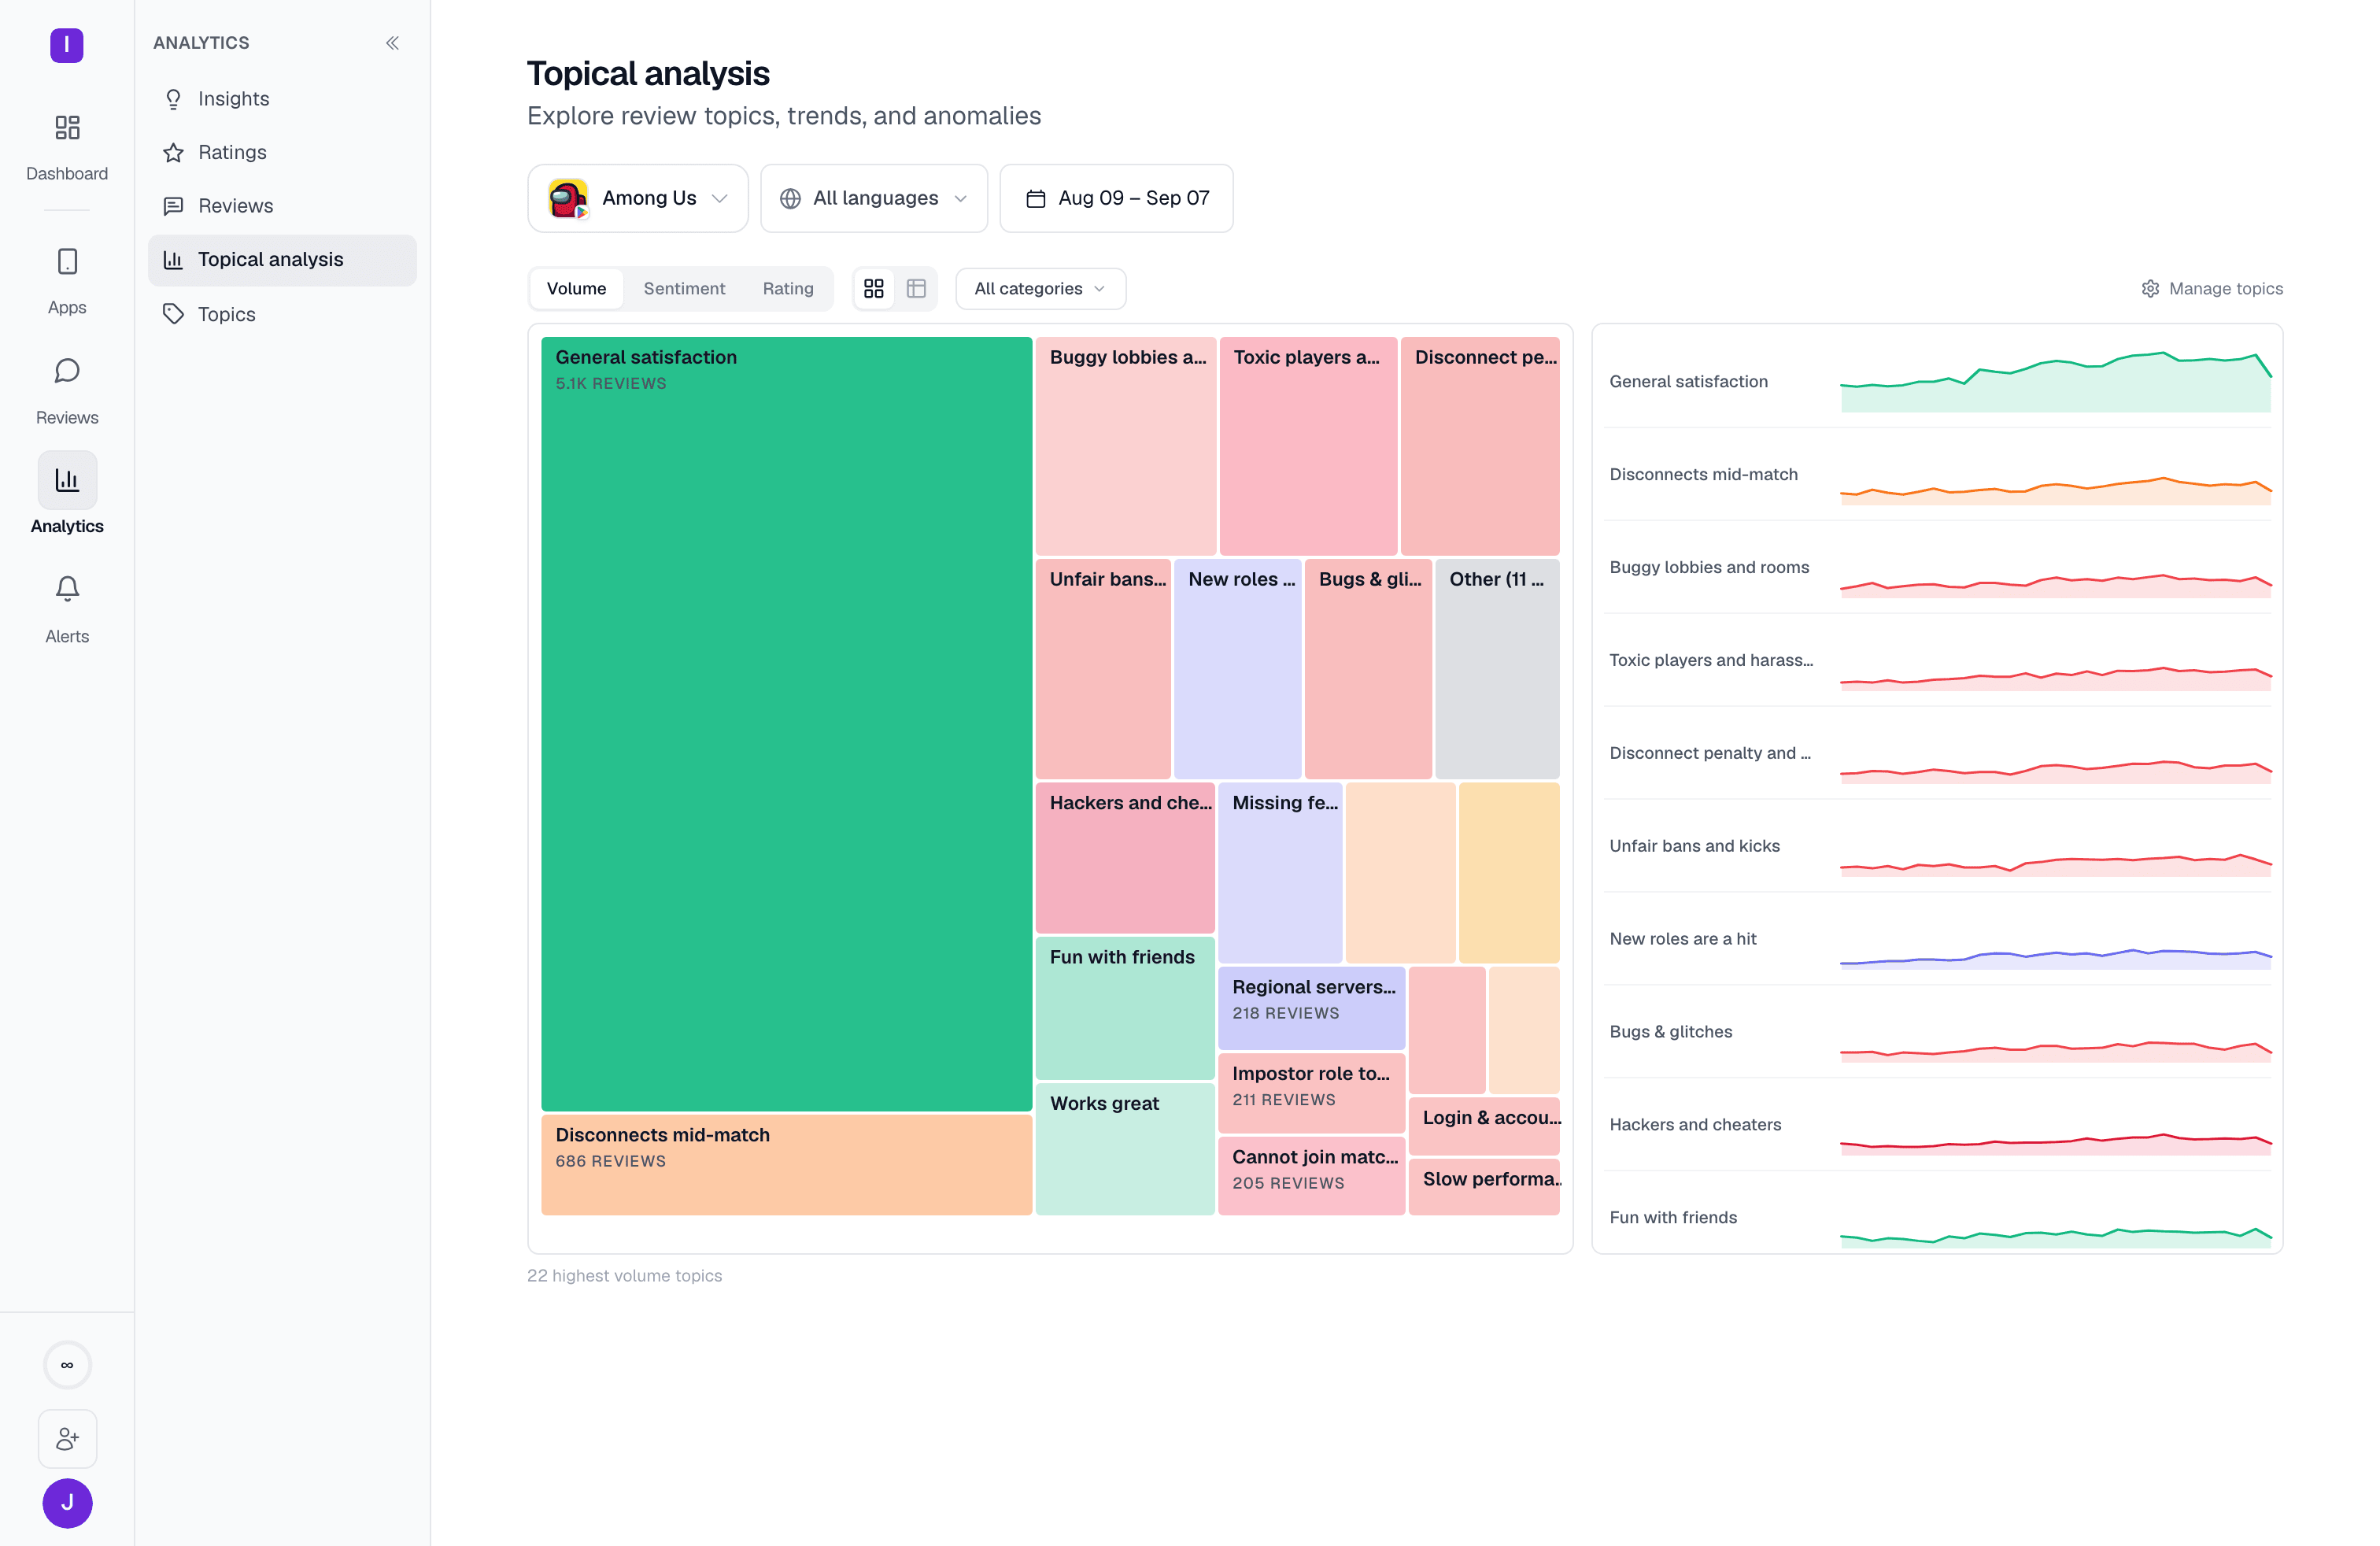
Topics are defined per app, so this page requires a single-app scope. Selecting more than one app in the filter bar replaces the page with a prompt explaining that topics have no shared vocabulary across apps, with one-click chips back to a single app.
Metric and view
A segmented control switches what the page is measuring:- Volume — review count per topic (the default).
- Sentiment — average sentiment score per topic.
- Rating — average star rating of the reviews carrying that topic.
- Treemap — every topic as a tile, sized and colored by the selected metric, with a topic-by-topic sparkline table beside it showing each topic’s recent trend at a glance.
- Table: a ranked list (
Topic distribution) with review count, sentiment, and rating trend per topic. Clicking a topic’s name opens its drilldown panel. Hovering a row shows two actions: AI summary for this topic opens the same panel, and Create an alert for this topic opens a new alert rule with the topic already filled in.
Narrowing by language
Because this is a single-app page, the shared language selector in the filter bar applies here too: pick a language to see the same treemap or table computed only from reviews in that language. This is how you’d check whether a topic is truly universal or concentrated in one locale — a spike in “Connectivity” that only shows up once you narrow to Turkish is a very different finding than one spread evenly across every language.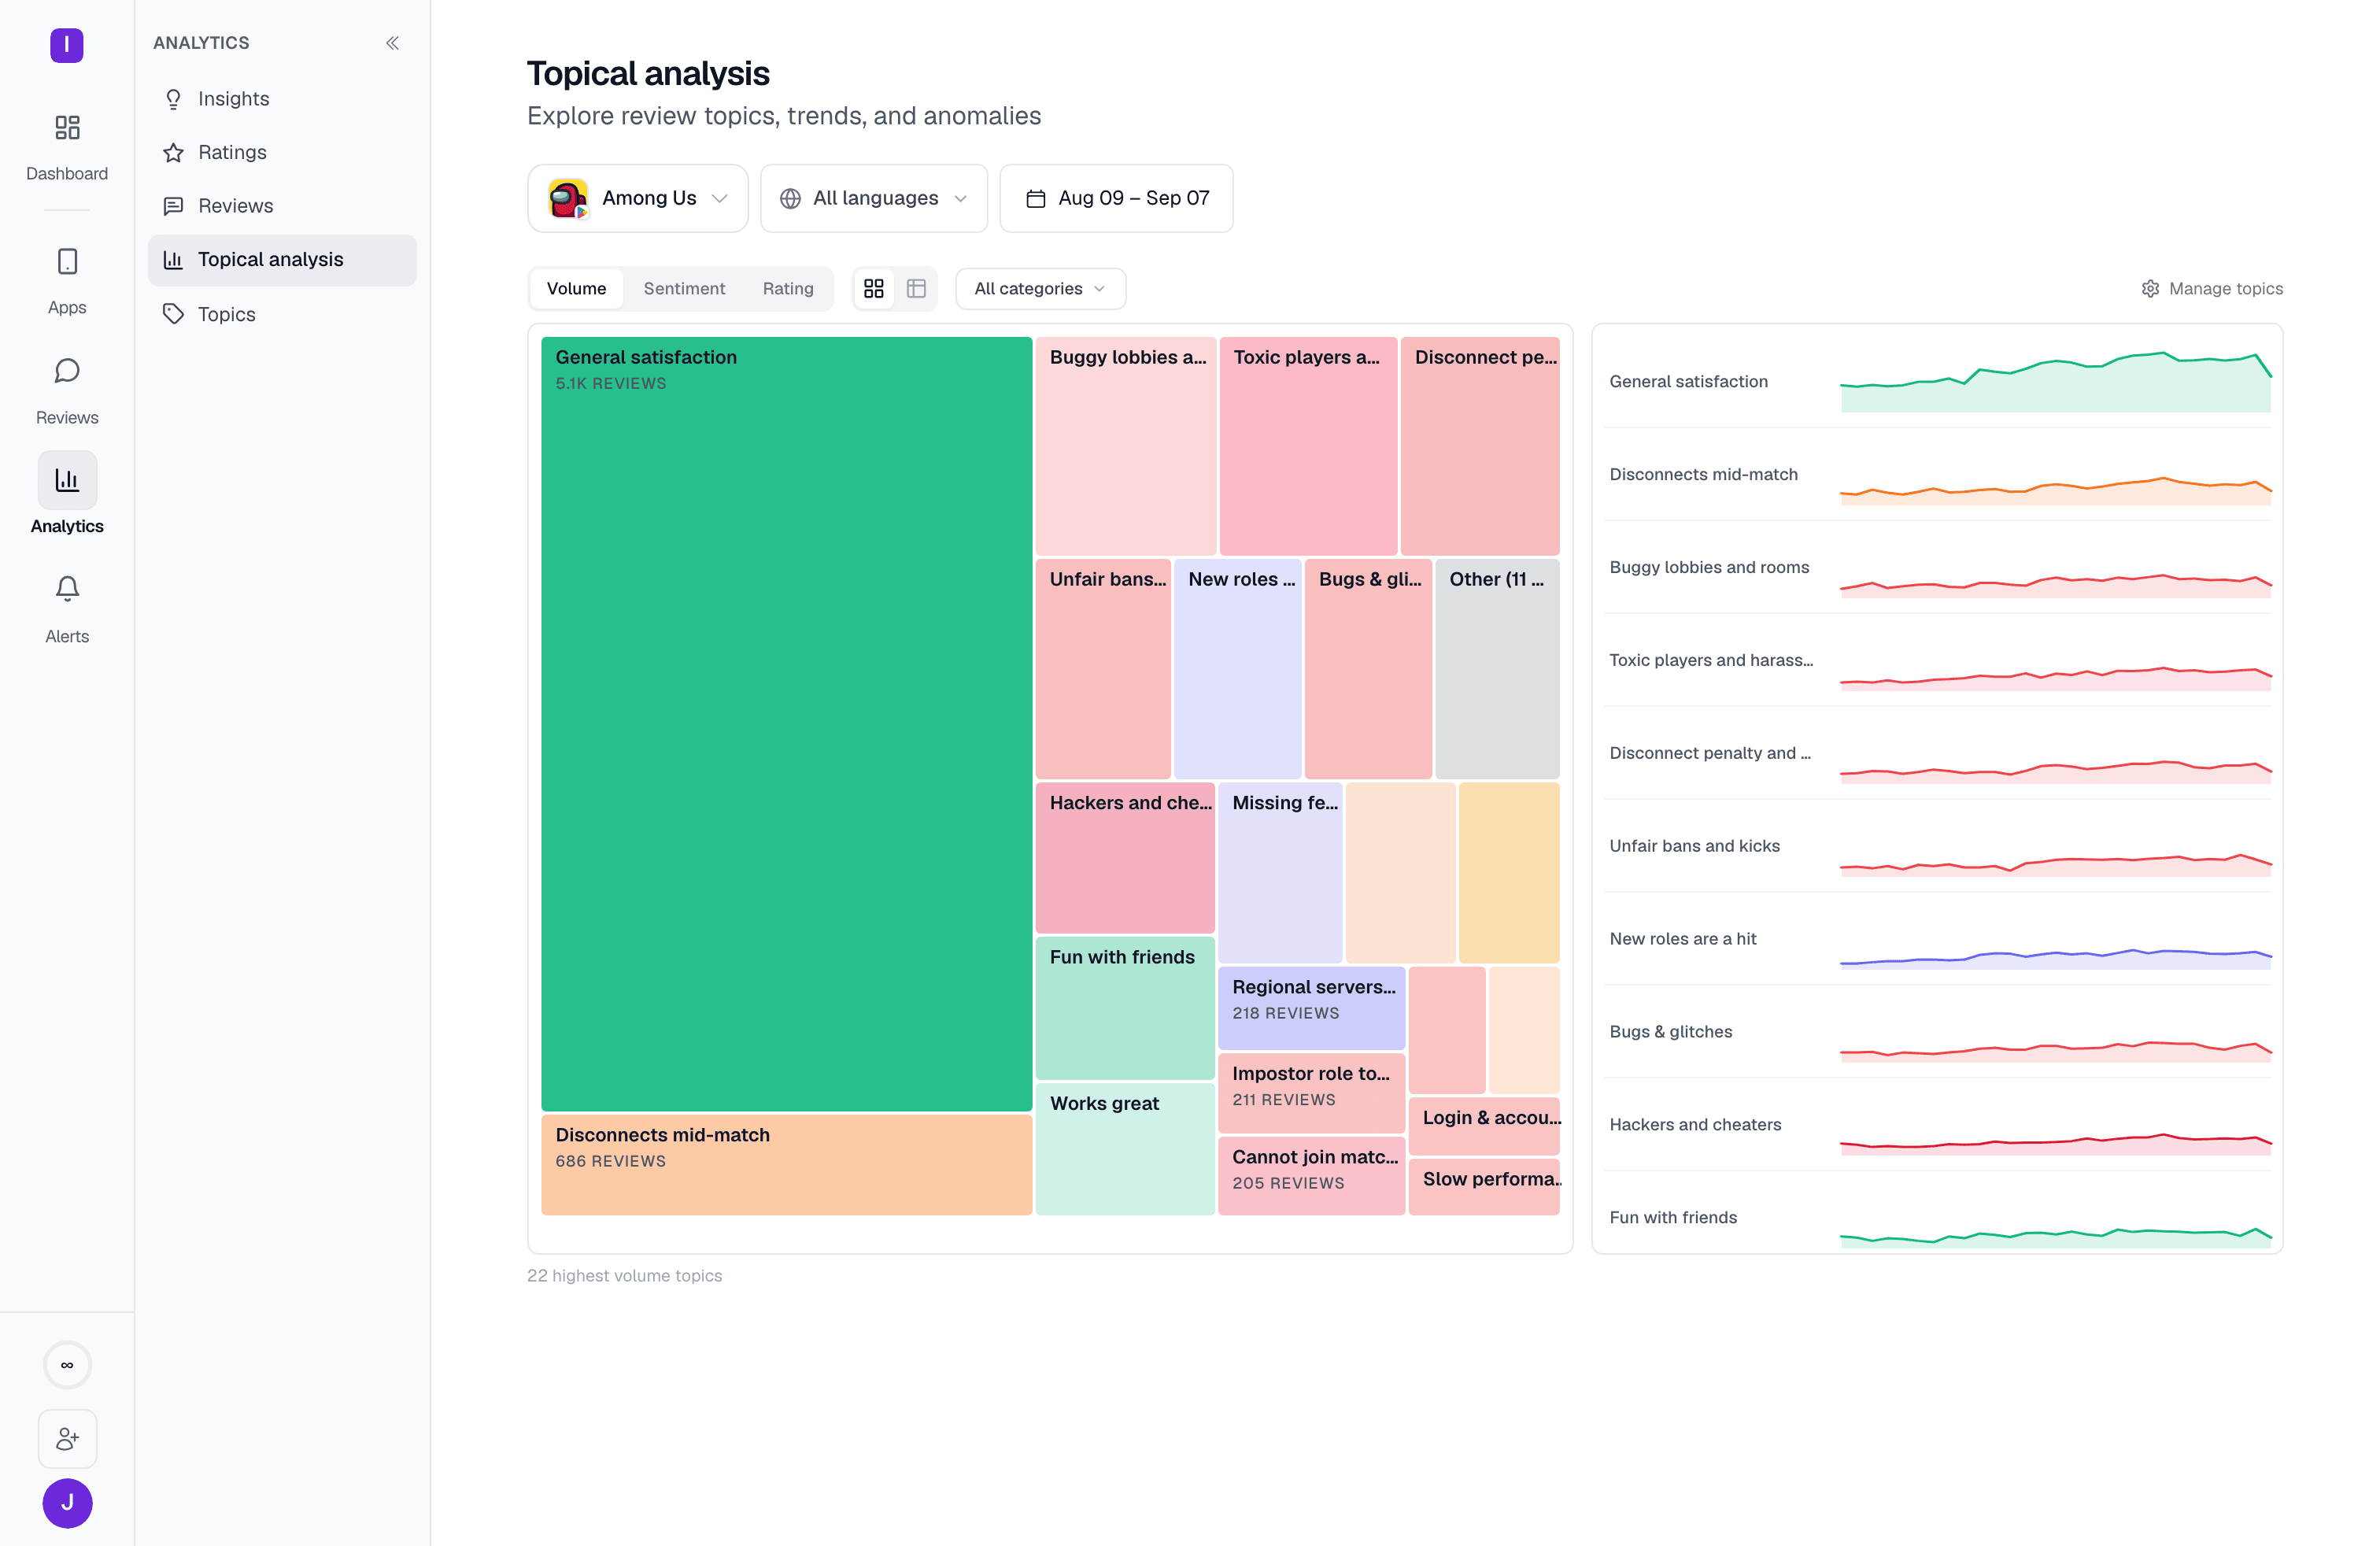
Drilling into a topic
Clicking any topic (in the treemap, the sparkline table, or the distribution table) opens a drilldown panel scoped to that topic and the page’s current date range and language filter, with the sample reviews behind the numbers. This is the same drilldown panel used from Insights’ arc cards, so a topic you’re tracking looks and behaves the same way no matter where you opened it from.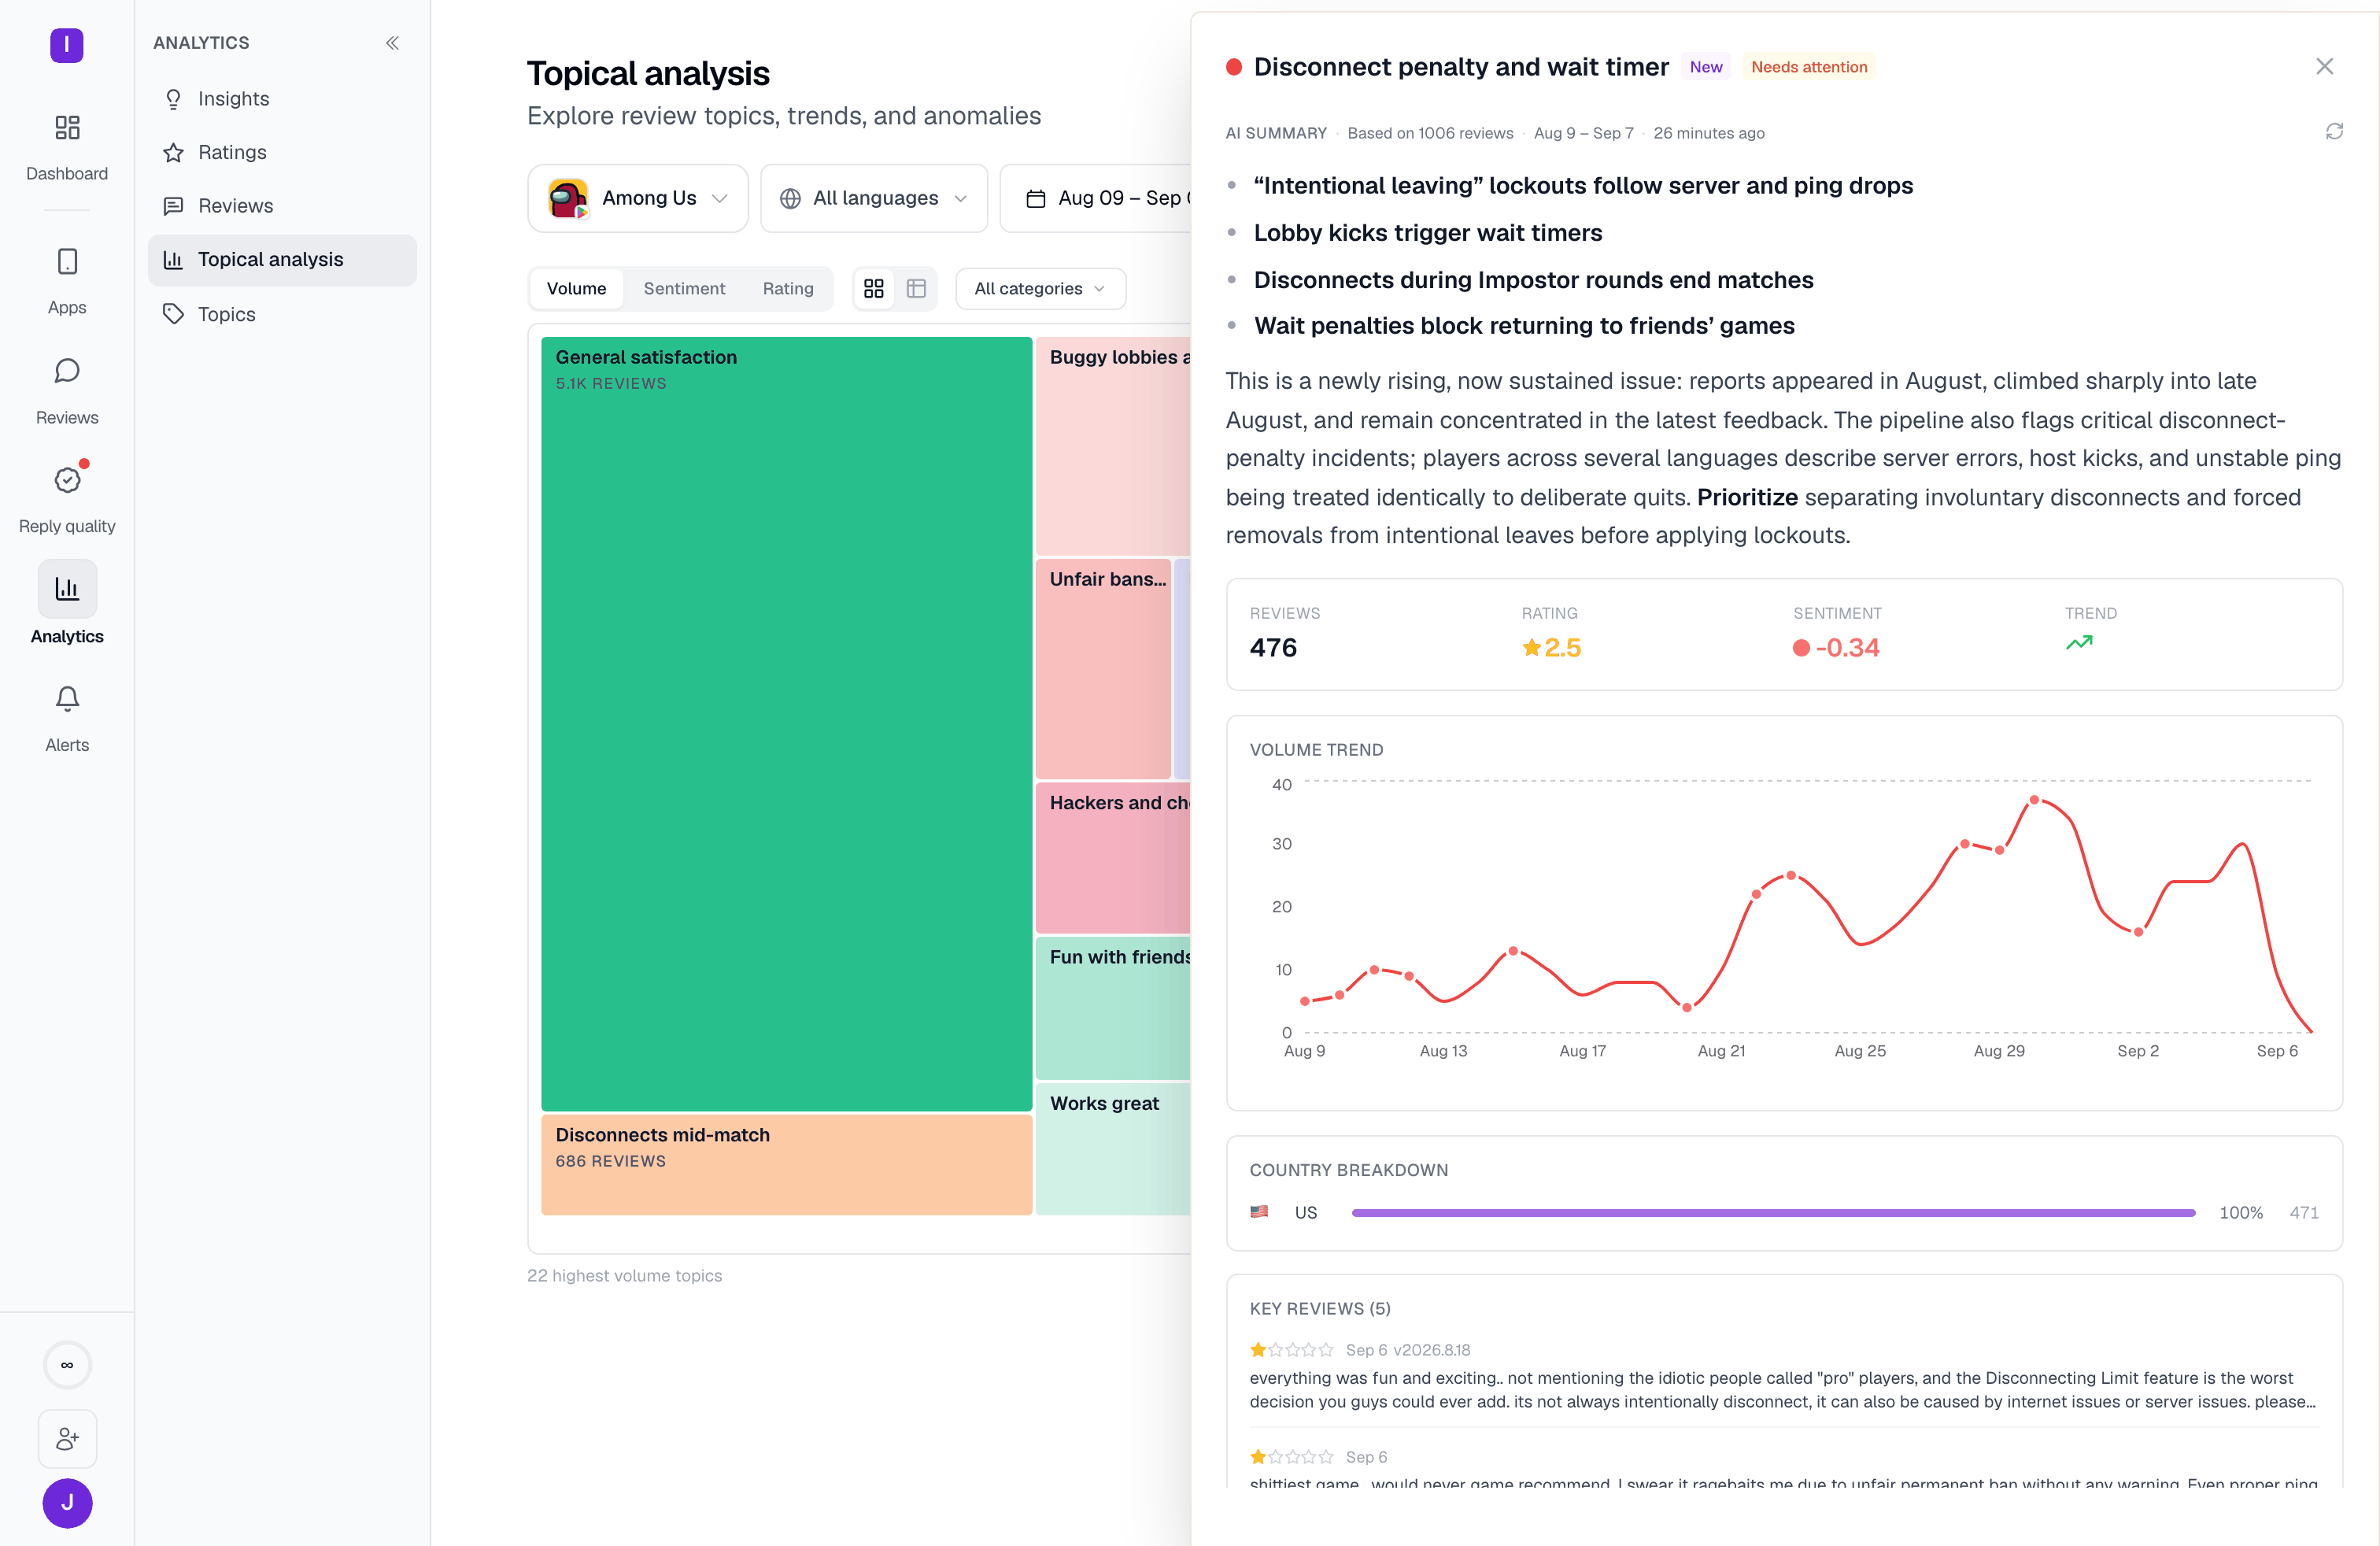
Insights
See the same topics as weekly arcs — born, peaked, and declining
Overview
Review volume and topic distribution for the full picture on one app