

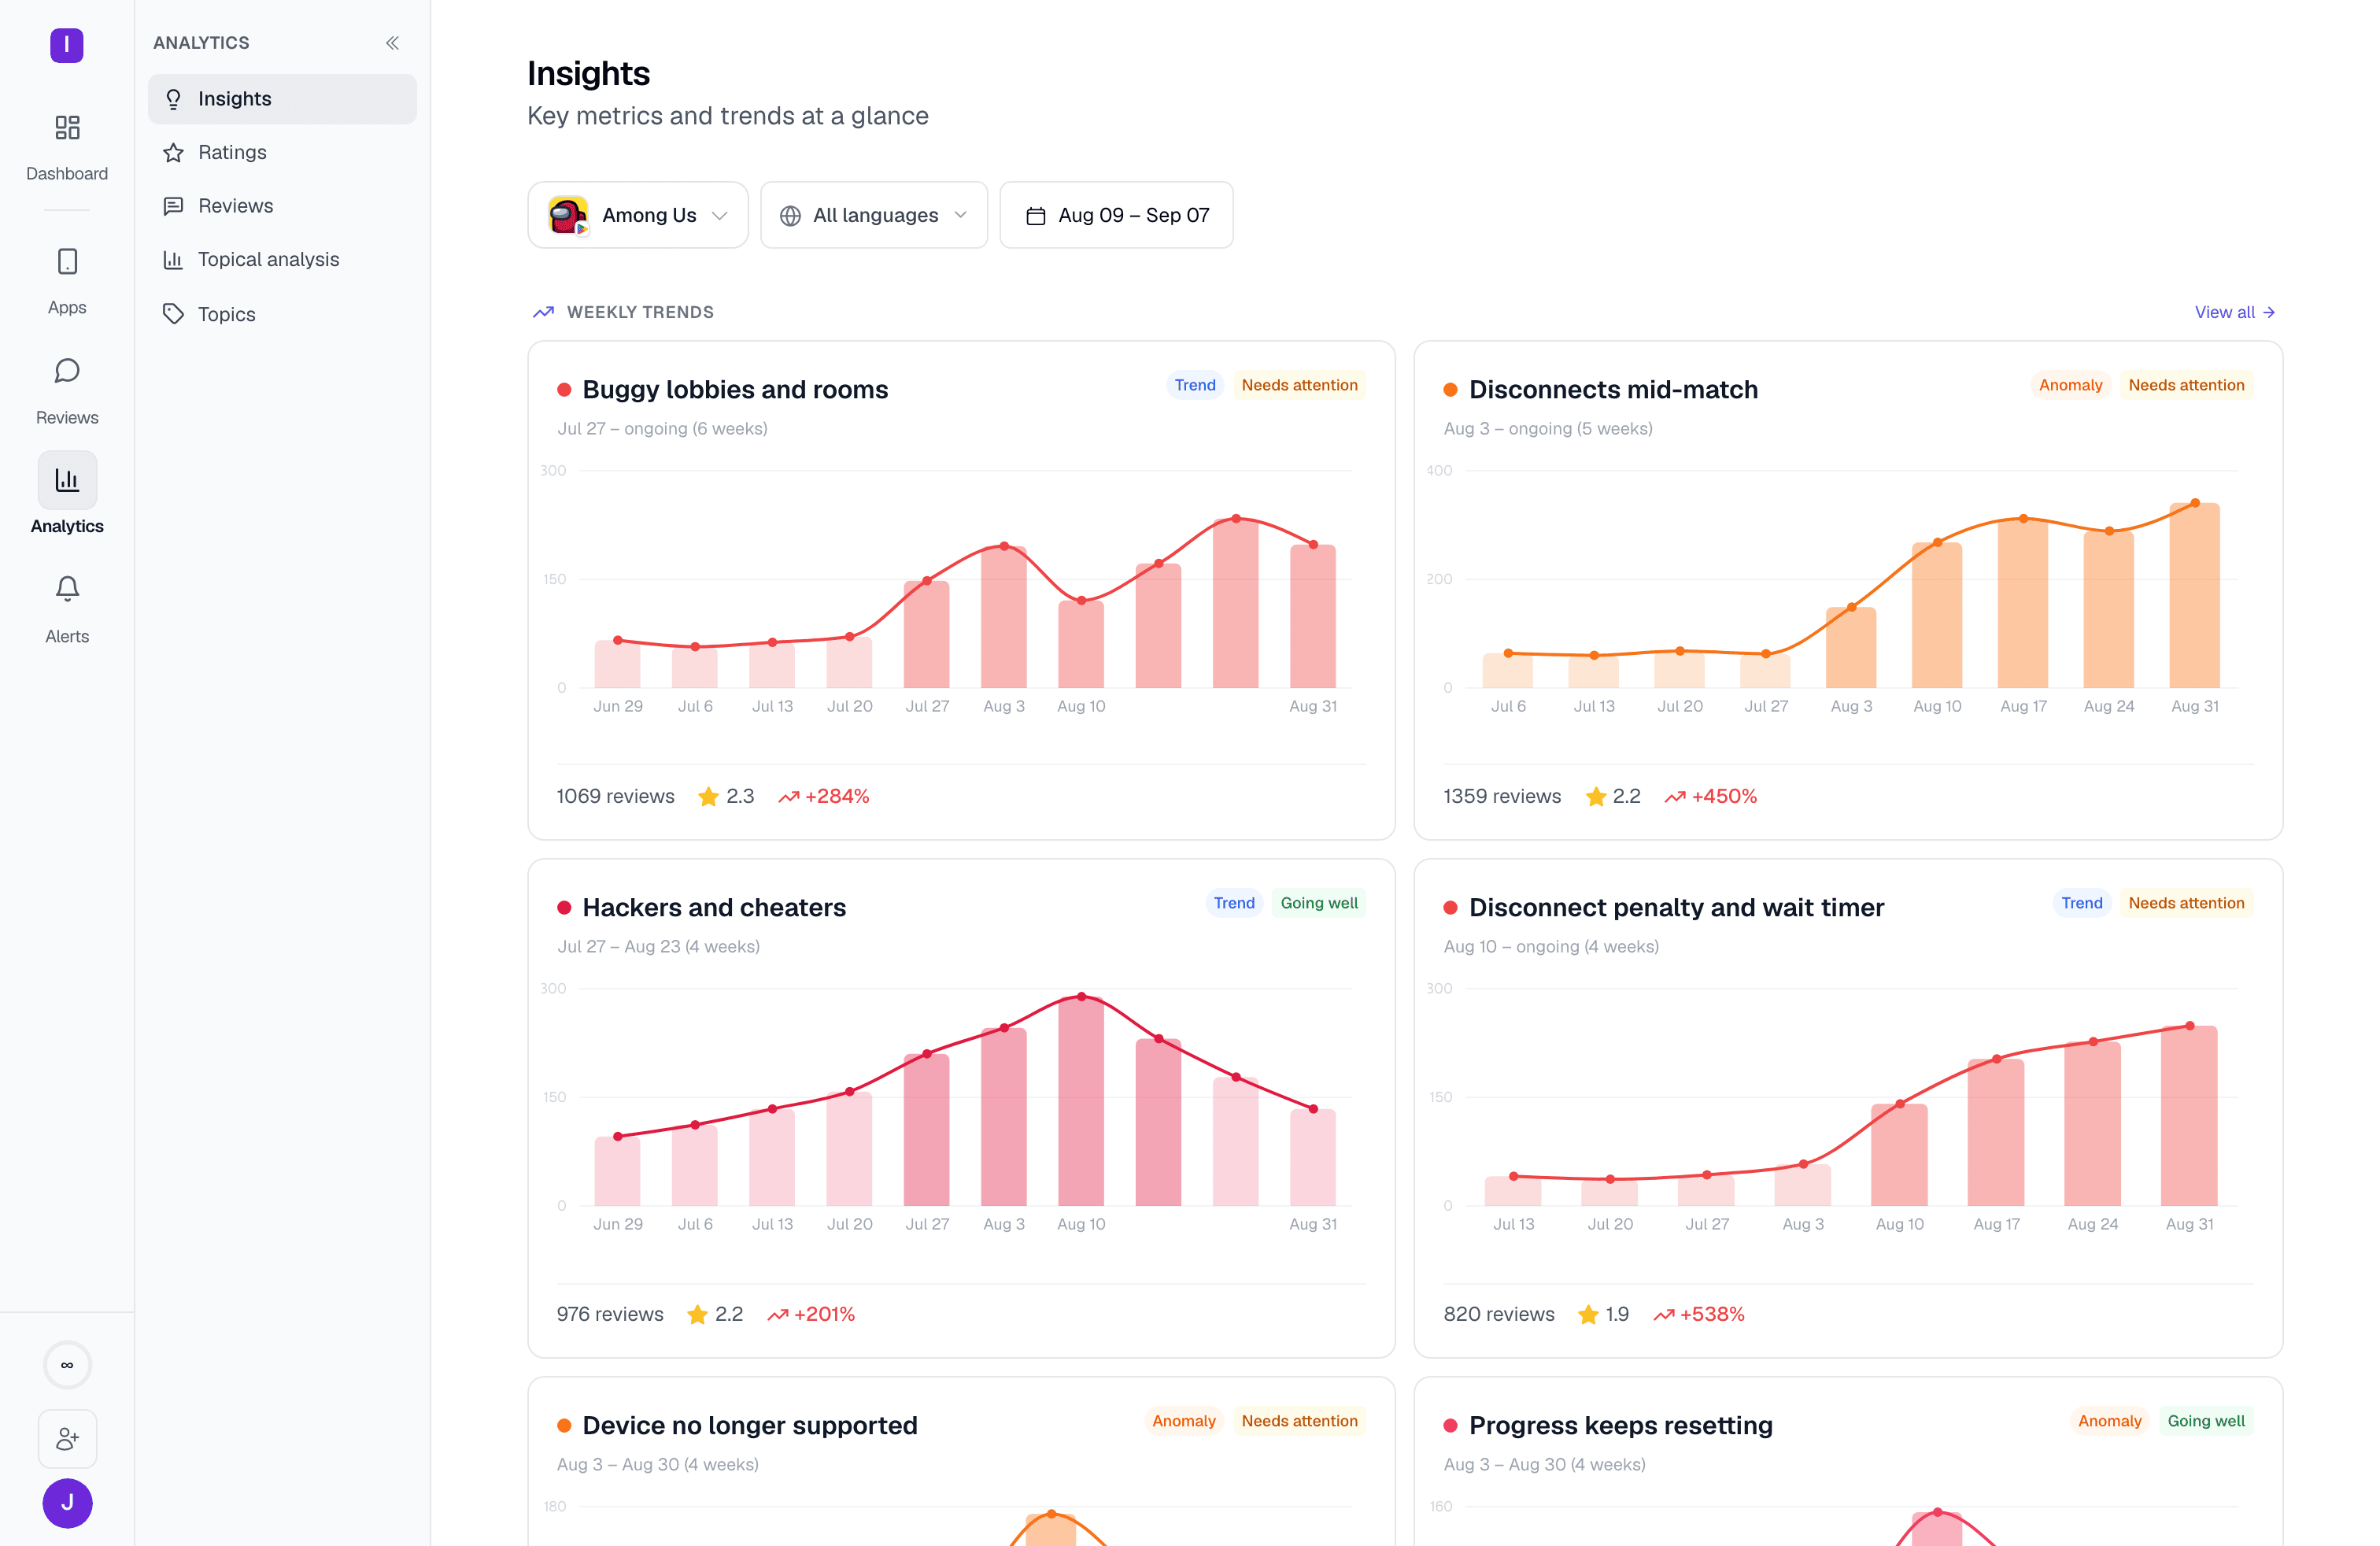
Insights
Weekly topic arcs — which stories are unfolding in your reviews right now, and how they’re trending
Reviews
Review volume, topic distribution, and sentiment for one app
Topical analysis
Explore every topic in your taxonomy by volume, sentiment, or rating, narrowed to one app and language
Ratings
Store rating trends across markets, broken down by language and app version
Reply performance
Coverage, speed, and the effect replies actually have on ratings — per rule and per person
Analytics is a Pro or Ultimate plan feature (an active AppReply trial also unlocks it), and is enabled per organization. If your account doesn’t have access yet, each page shows an upgrade prompt instead of a blank screen.
The shared filter bar
Every Analytics page opens with the same row of controls: an app scope selector, a date range picker, and (on single-app pages) a language selector. This state lives in one place per organization. Switching between Home and any Analytics page keeps the same apps, window, and language selected — you don’t have to re-pick them on every page. App scope can name one app or several. Analytics reports on a portfolio by default, and most surfaces fold multiple apps’ numbers together at the top of the page. Anything that depends on a single app’s own vocabulary — topics, per-language and per-version breakdowns, the weekly arc detail — asks you to narrow to one app first. If you haven’t, it shows a “pick a single app” prompt with your connected apps as one-click chips. Category and topic appear on the Reviews page only, and only once you’ve picked a single app that has topics. The category control lists your topic categories with the number of topics in each. The topic control lists topics under their categories with review counts. Narrowing to either scopes that whole page. Language narrows a single-app view to one locale. It’s hidden until you’ve picked exactly one app, since there’s nothing to narrow across a multi-app scope. It’s also hidden on the Ratings page: Google Play publishes one global star rating shared across every storefront, so a per-language breakdown would just be noise there. Everywhere else, the dropdown lists only the languages your reviews actually contain. On the longer pages (Insights, Ratings, and Reviews), this filter row stays pinned as you scroll, so a chart three screens down is never read against the wrong window.Review volume and topic distribution
The Reviews page reports on a single app’s window as a whole: how many reviews came in, what they were about, and how sentiment moved. It carries its own category and topic filters in the shared bar, an AI-written summary of the period, and breakdowns by language, country, region, and app version.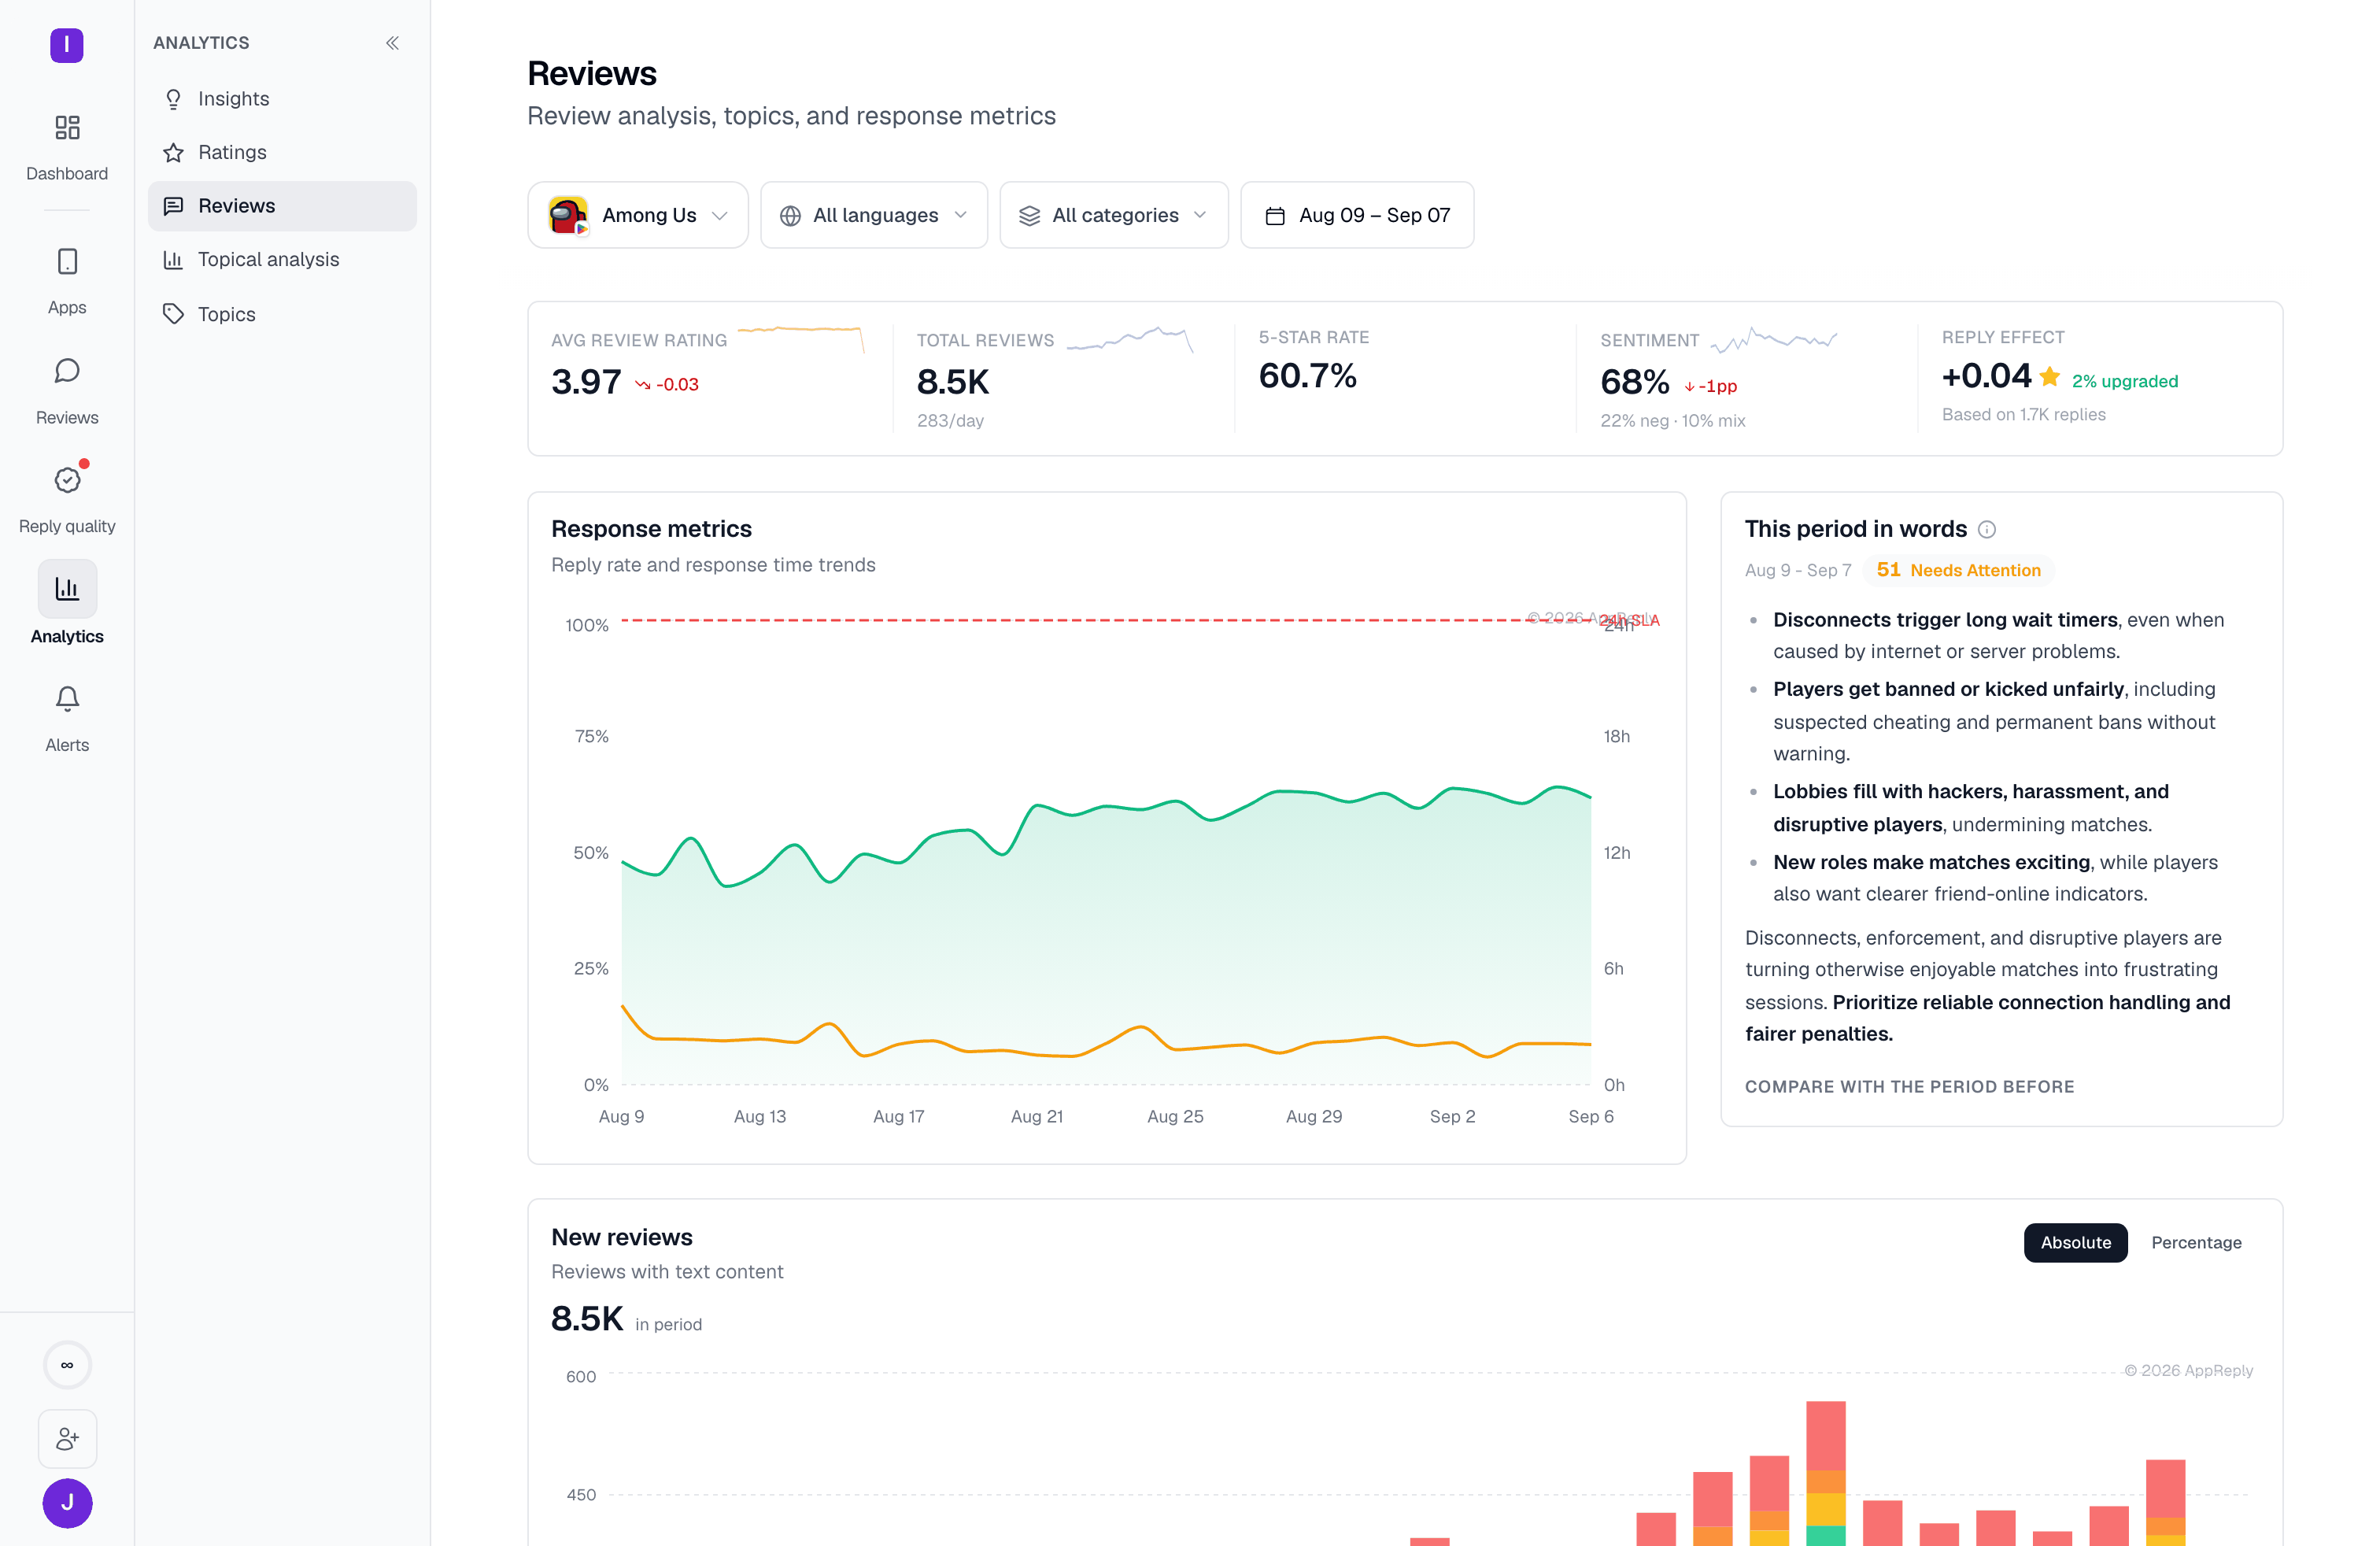
Review feed
Browse and respond to the individual reviews behind these numbers
AI summary
See the same topics from inside the review feed’s own pattern detection