

The language selector is hidden on this page. Google Play publishes one global star rating shared across every storefront, so a per-language breakdown of that single number would be noise. It’s meaningful only for the by-language table further down, which reads per-country rating snapshots instead.
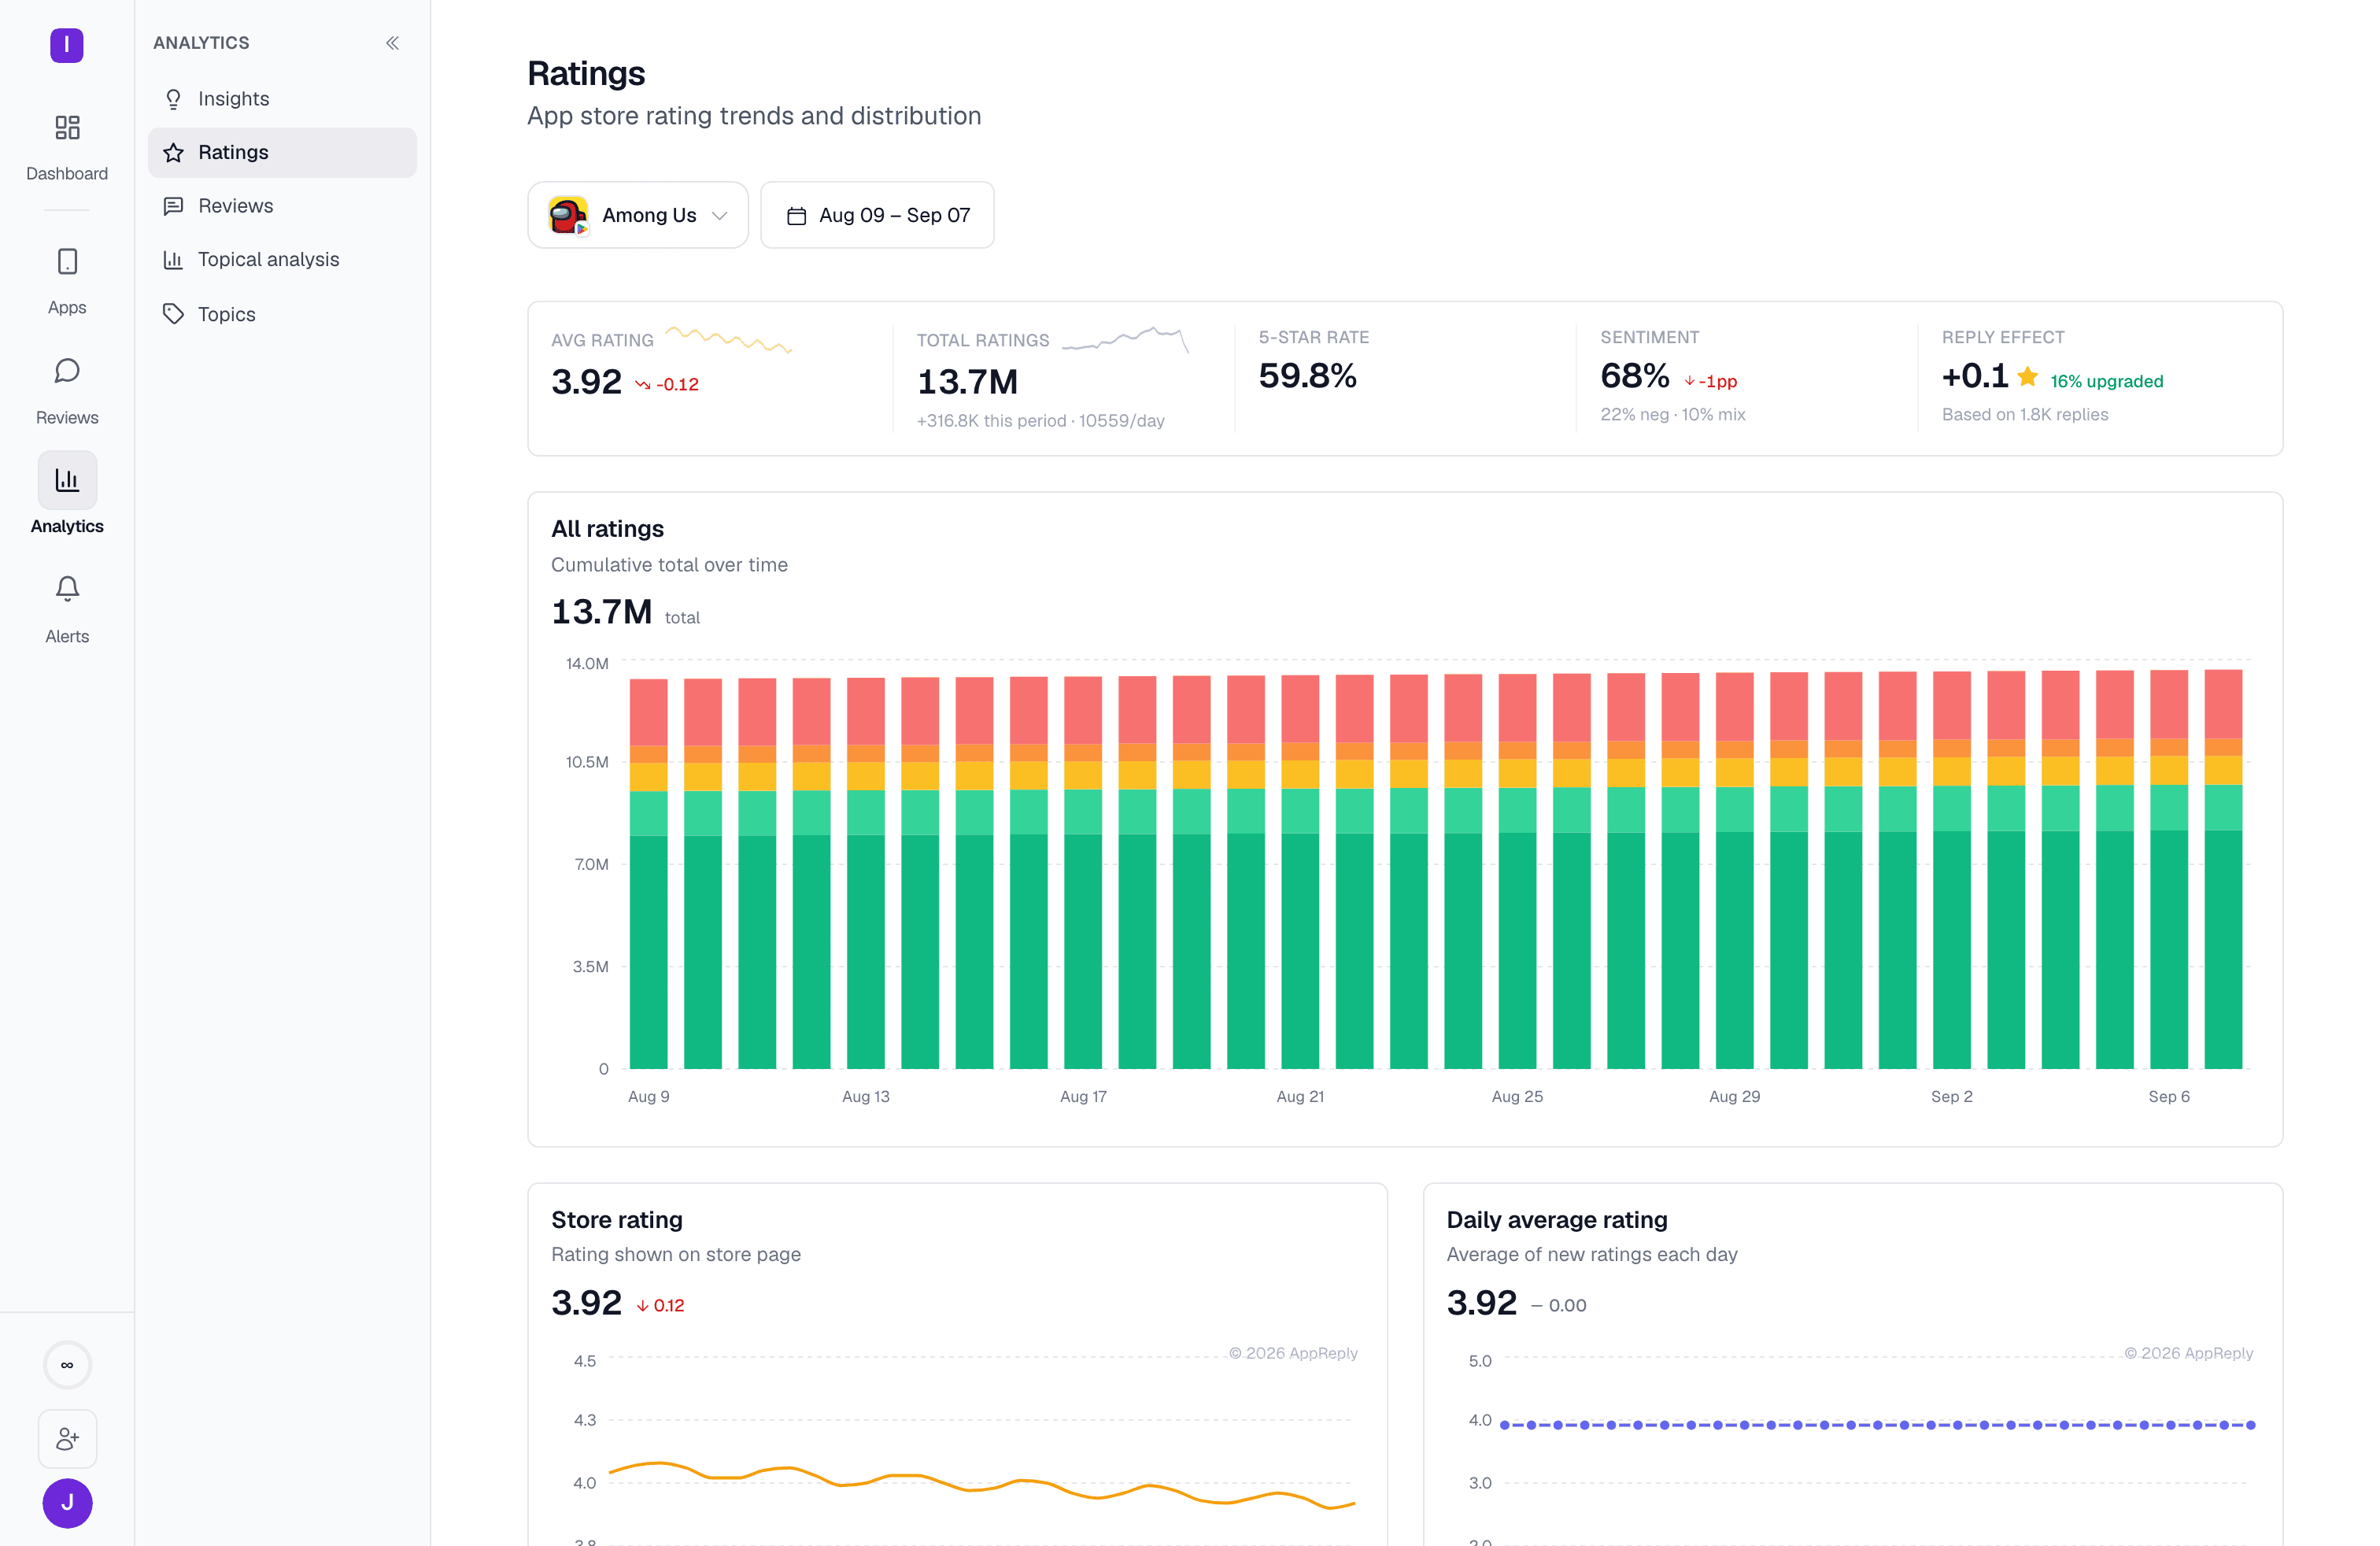
Vitals and charts
The top of the page gives a vitals row (average rating, review count, negative-review count, and reply effect for the window, each with a sparkline and a period-over-period delta) followed by a set of charts:- Daily average rating — the average of new ratings received each day, with a linear trend line over the period.
- Store rating — the rating actually shown on your store listing, snapshotted over time.
- New rating distribution over time — the star-rating composition of incoming ratings each day, normalized to 100% so a shift in the mix (more 1-stars, fewer 5-stars) is visible even while total volume changes.
- All ratings — cumulative rating total over time.
- New ratings — a bar chart of all star ratings received each day, including silent (no-text) ratings alongside written reviews.
Breakdown: by language and by version
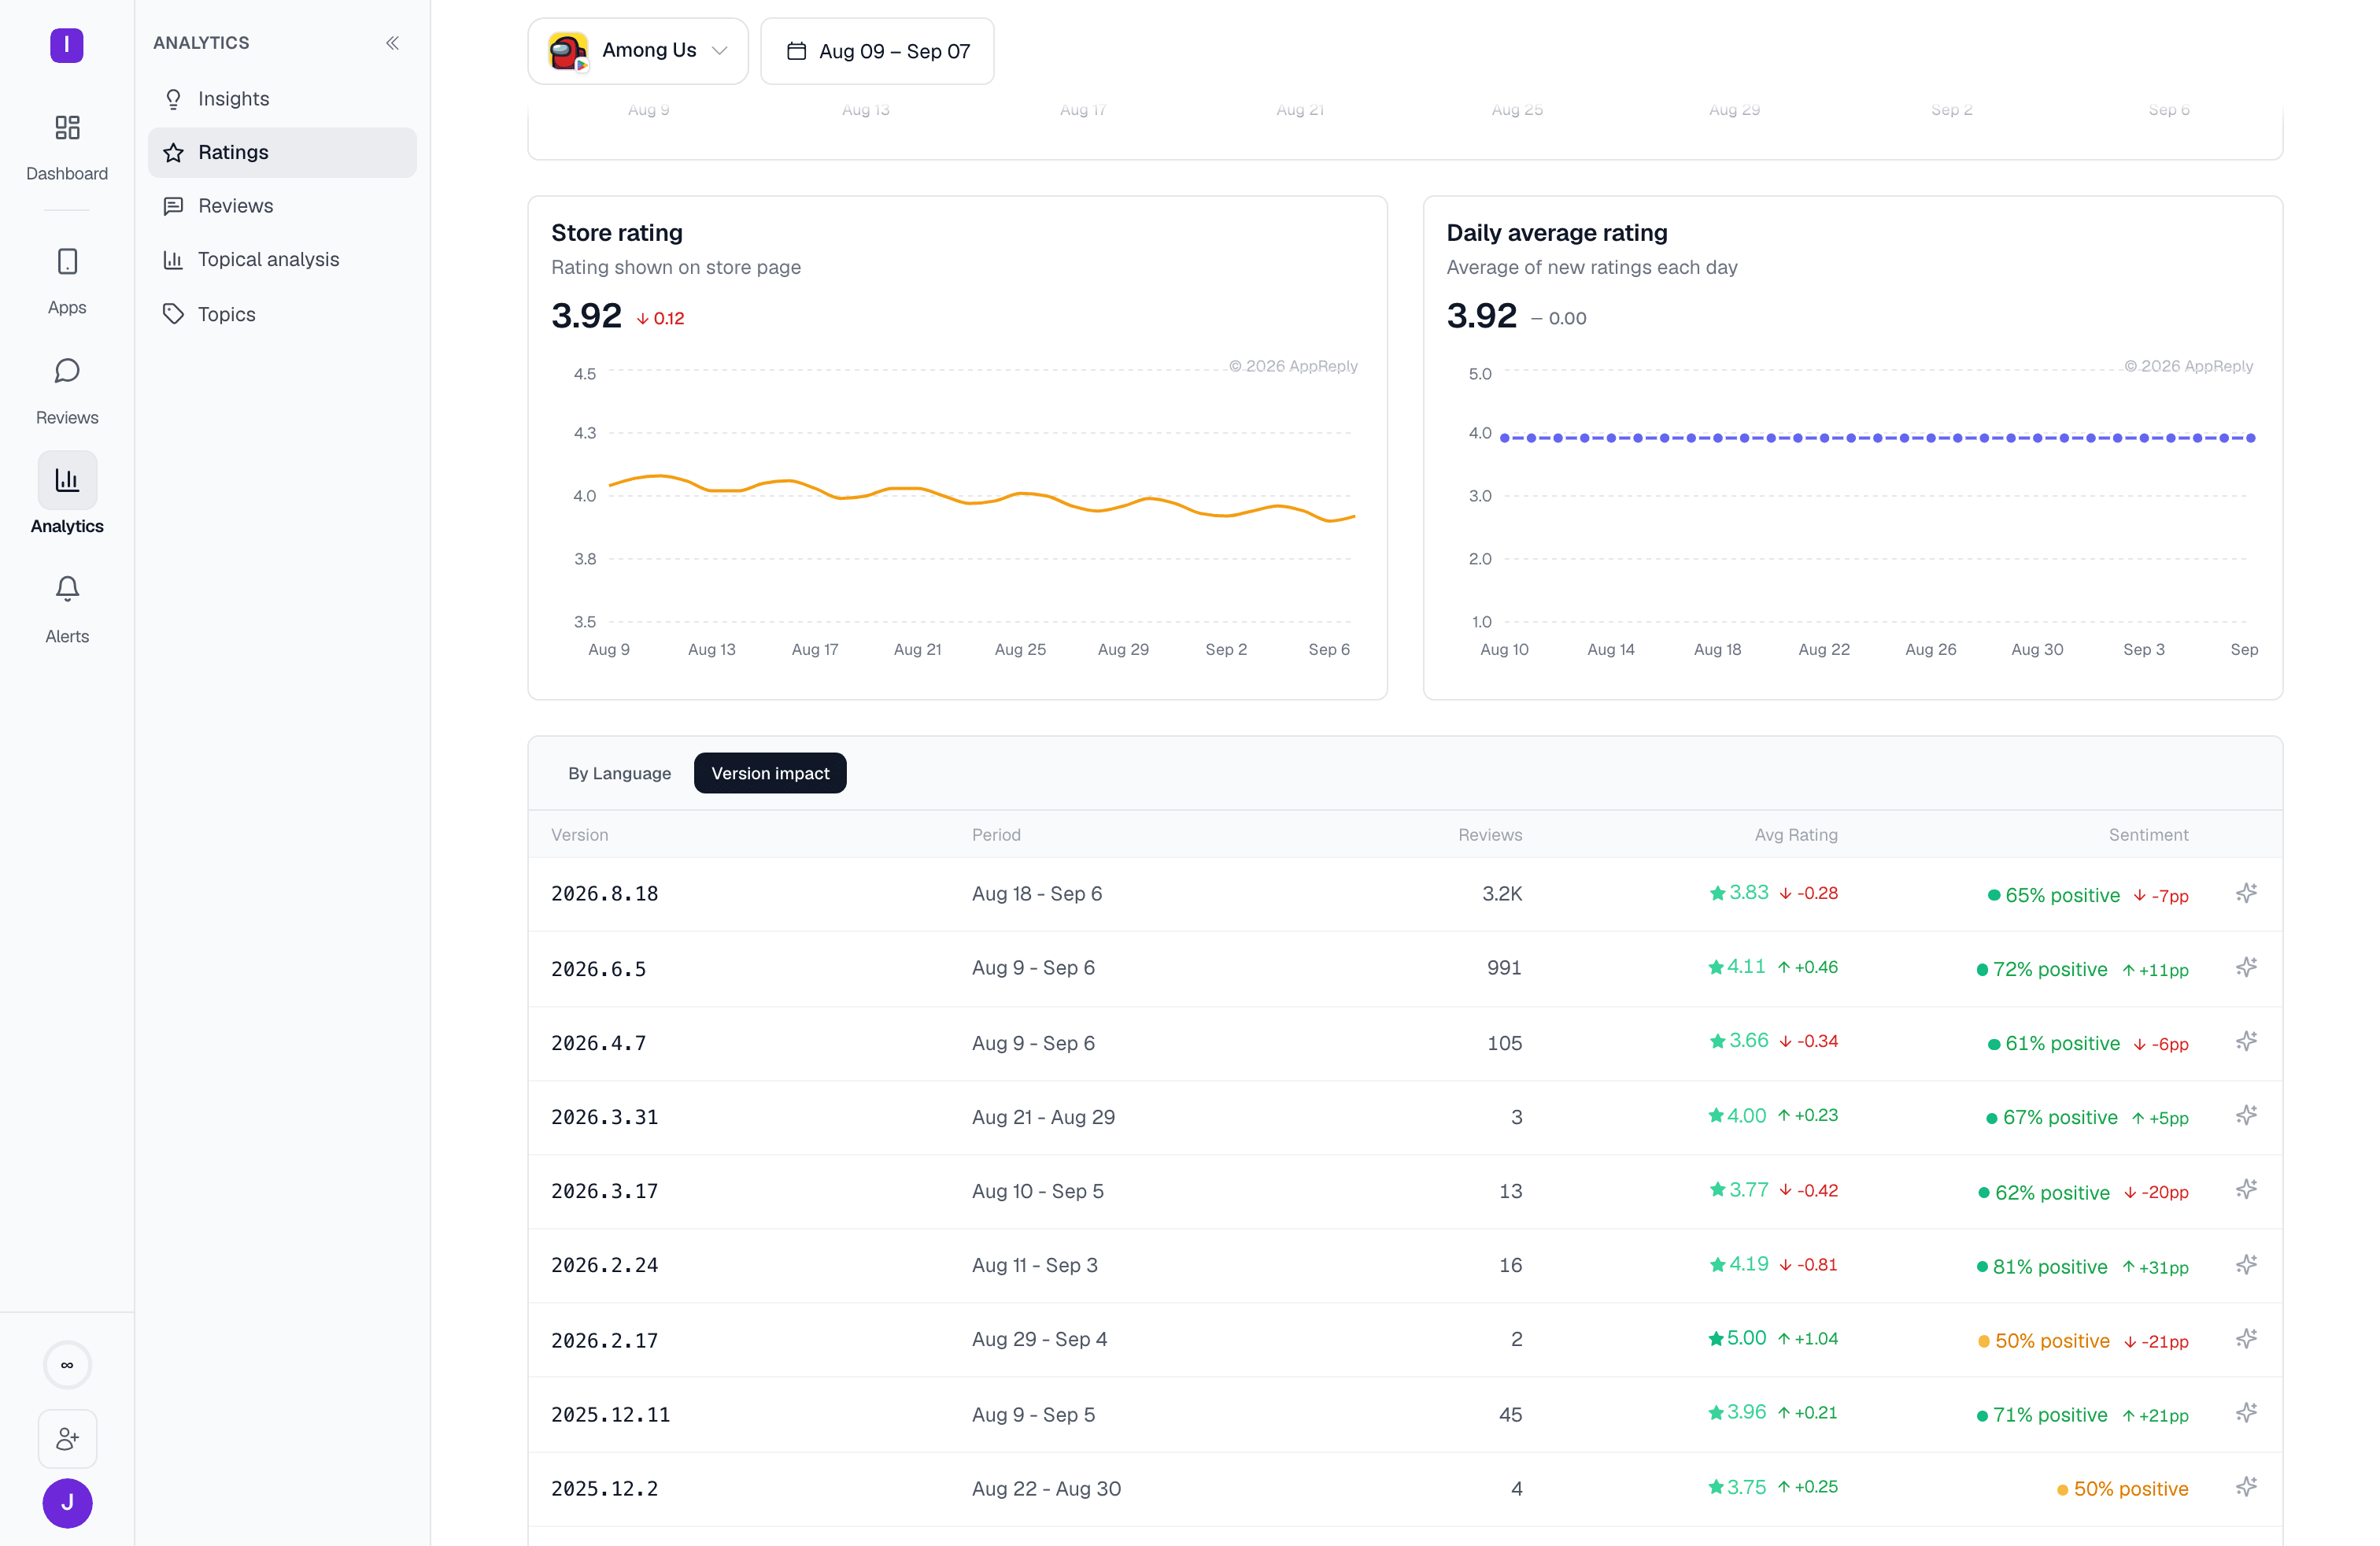
For a single-app scope, a tabbed table beneath the charts switches between two breakdowns: By Language shows the store rating per storefront/locale. Google Play and App Store each keep a separate rating histogram per country, so this table reads that per-country data as a language breakdown, via each language’s mapped storefront country. Each row shows current score, rating delta, and total ratings for that language.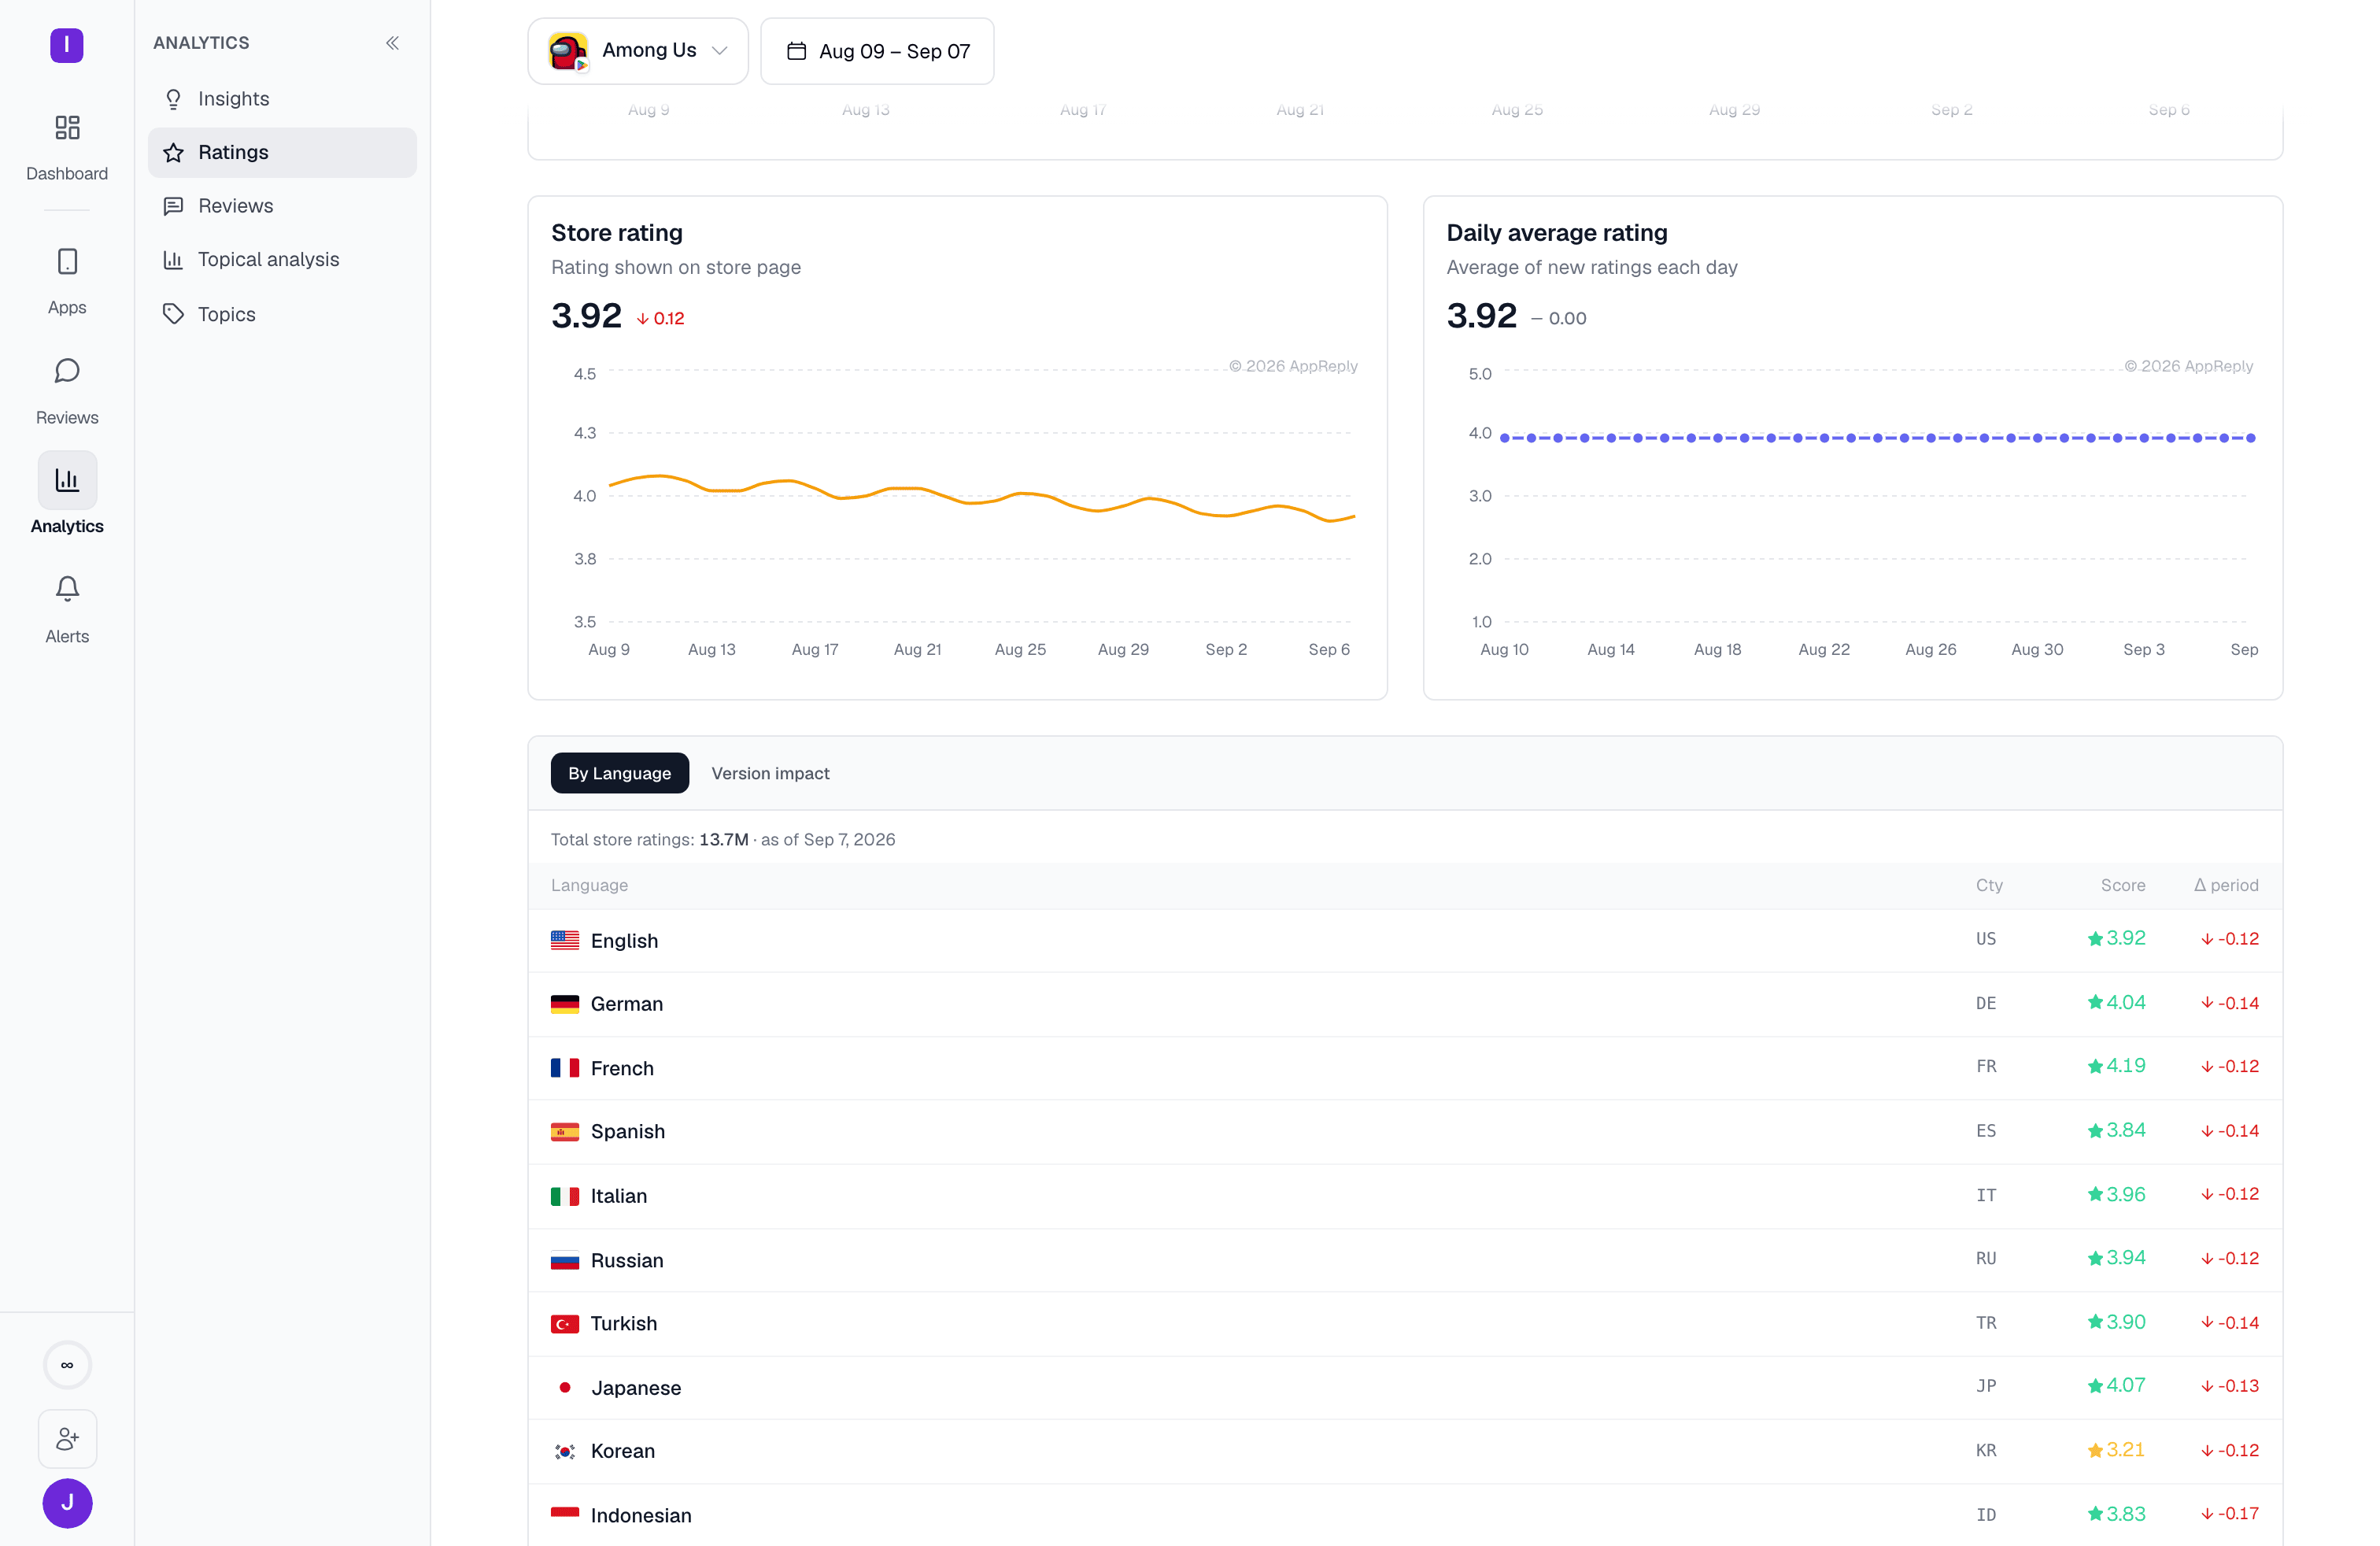
Overview
Review volume and topic distribution alongside these rating trends
Reply performance
See whether replying to reviews actually changes their rating