> ## Documentation Index
> Fetch the complete documentation index at: https://docs.appreply.co/llms.txt
> Use this file to discover all available pages before exploring further.
# Insights
> Weekly topic arcs: which stories in your reviews are unfolding right now, and how they're trending
Insights is the default landing page for Analytics (`/analytics` redirects here). Instead of a fixed dashboard of charts, it tells the story of your review volume week by week — which topics spiked, which are still climbing, and which have already peaked and faded.
 ## Weekly topic arcs
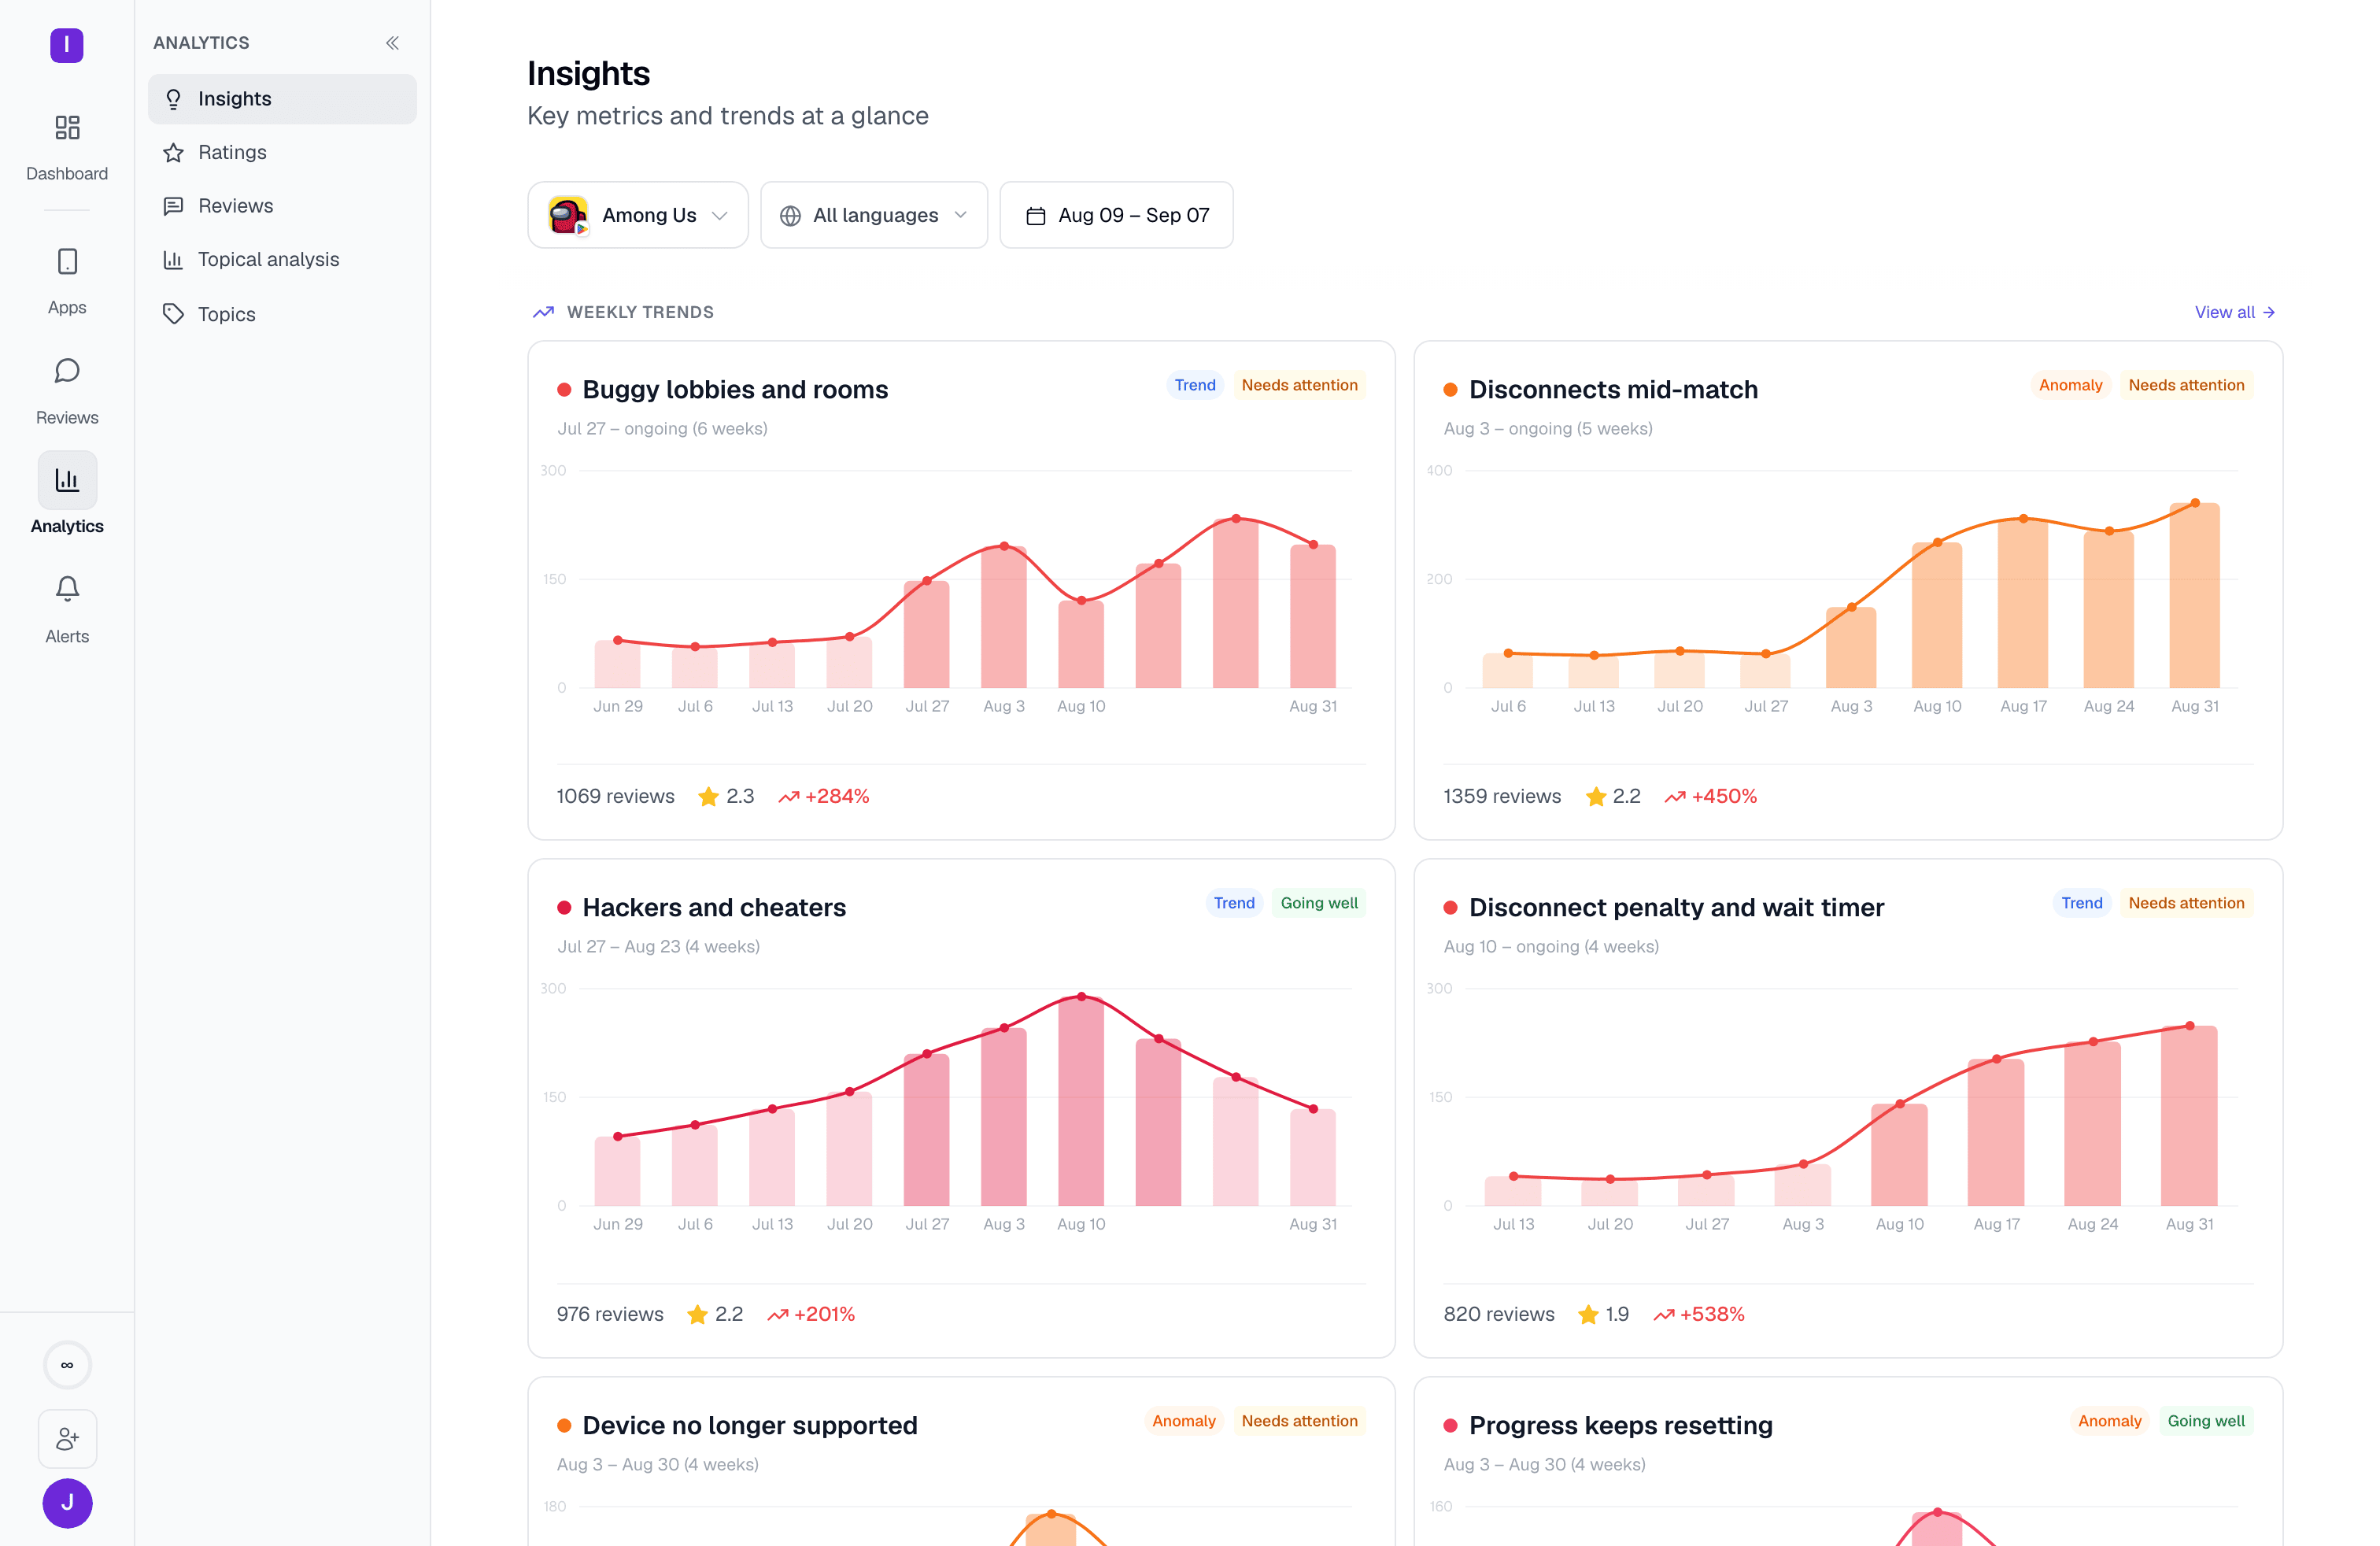
The core unit of this page is an **arc**, not a single week and not the picker's whole date range. An arc is one continuous stretch of weeks where a topic ran meaningfully above its own quiet baseline. That baseline is the 25th percentile of the topic's own weekly review counts — so "elevated" is judged against how that specific topic normally behaves, not a fixed threshold shared across all topics.
Each arc becomes its own card, with:
* A **headline and short summary**, written by AI from the arc's peak week.
* A **date span**, e.g. "Aug 4 – ongoing (6 weeks)" or "before Jul 21 – Aug 10 (4 weeks+)" — arcs that started before the earliest week fetched are labeled "before" that date rather than guessing a birth date.
* A **Trend or Anomaly badge**, plus **Needs attention** or **Going well** where the topic's sentiment or volume shift is significant enough to call out. A card with neither badge is simply Stable.
* A **weekly chart**, with the arc's own weeks darkened against a few weeks of surrounding context.
* For most arcs that lasted a single week, a **daily chart** instead: the arc's days plus the week before for context. When the trend started partway through the week, its date span counts days from the day it emerged (for example "Sep 11 – ongoing (3 days)"), and the review count and rating under the chart cover those same days.
* Up to two **real reviewer quotes** pulled from the arc's peak week, so the story is backed by an actual example, not just a number.
Clicking a card opens the topic's drilldown panel scoped to that arc's own dates (not the page's date picker). Hovering a card shows an **Open in Reviews** link to the matching reviews in the review feed, and the panel carries the same link. Even when a one-week card's label counts days, the click and the link cover the whole week.
## Weekly topic arcs
The core unit of this page is an **arc**, not a single week and not the picker's whole date range. An arc is one continuous stretch of weeks where a topic ran meaningfully above its own quiet baseline. That baseline is the 25th percentile of the topic's own weekly review counts — so "elevated" is judged against how that specific topic normally behaves, not a fixed threshold shared across all topics.
Each arc becomes its own card, with:
* A **headline and short summary**, written by AI from the arc's peak week.
* A **date span**, e.g. "Aug 4 – ongoing (6 weeks)" or "before Jul 21 – Aug 10 (4 weeks+)" — arcs that started before the earliest week fetched are labeled "before" that date rather than guessing a birth date.
* A **Trend or Anomaly badge**, plus **Needs attention** or **Going well** where the topic's sentiment or volume shift is significant enough to call out. A card with neither badge is simply Stable.
* A **weekly chart**, with the arc's own weeks darkened against a few weeks of surrounding context.
* For most arcs that lasted a single week, a **daily chart** instead: the arc's days plus the week before for context. When the trend started partway through the week, its date span counts days from the day it emerged (for example "Sep 11 – ongoing (3 days)"), and the review count and rating under the chart cover those same days.
* Up to two **real reviewer quotes** pulled from the arc's peak week, so the story is backed by an actual example, not just a number.
Clicking a card opens the topic's drilldown panel scoped to that arc's own dates (not the page's date picker). Hovering a card shows an **Open in Reviews** link to the matching reviews in the review feed, and the panel carries the same link. Even when a one-week card's label counts days, the click and the link cover the whole week.
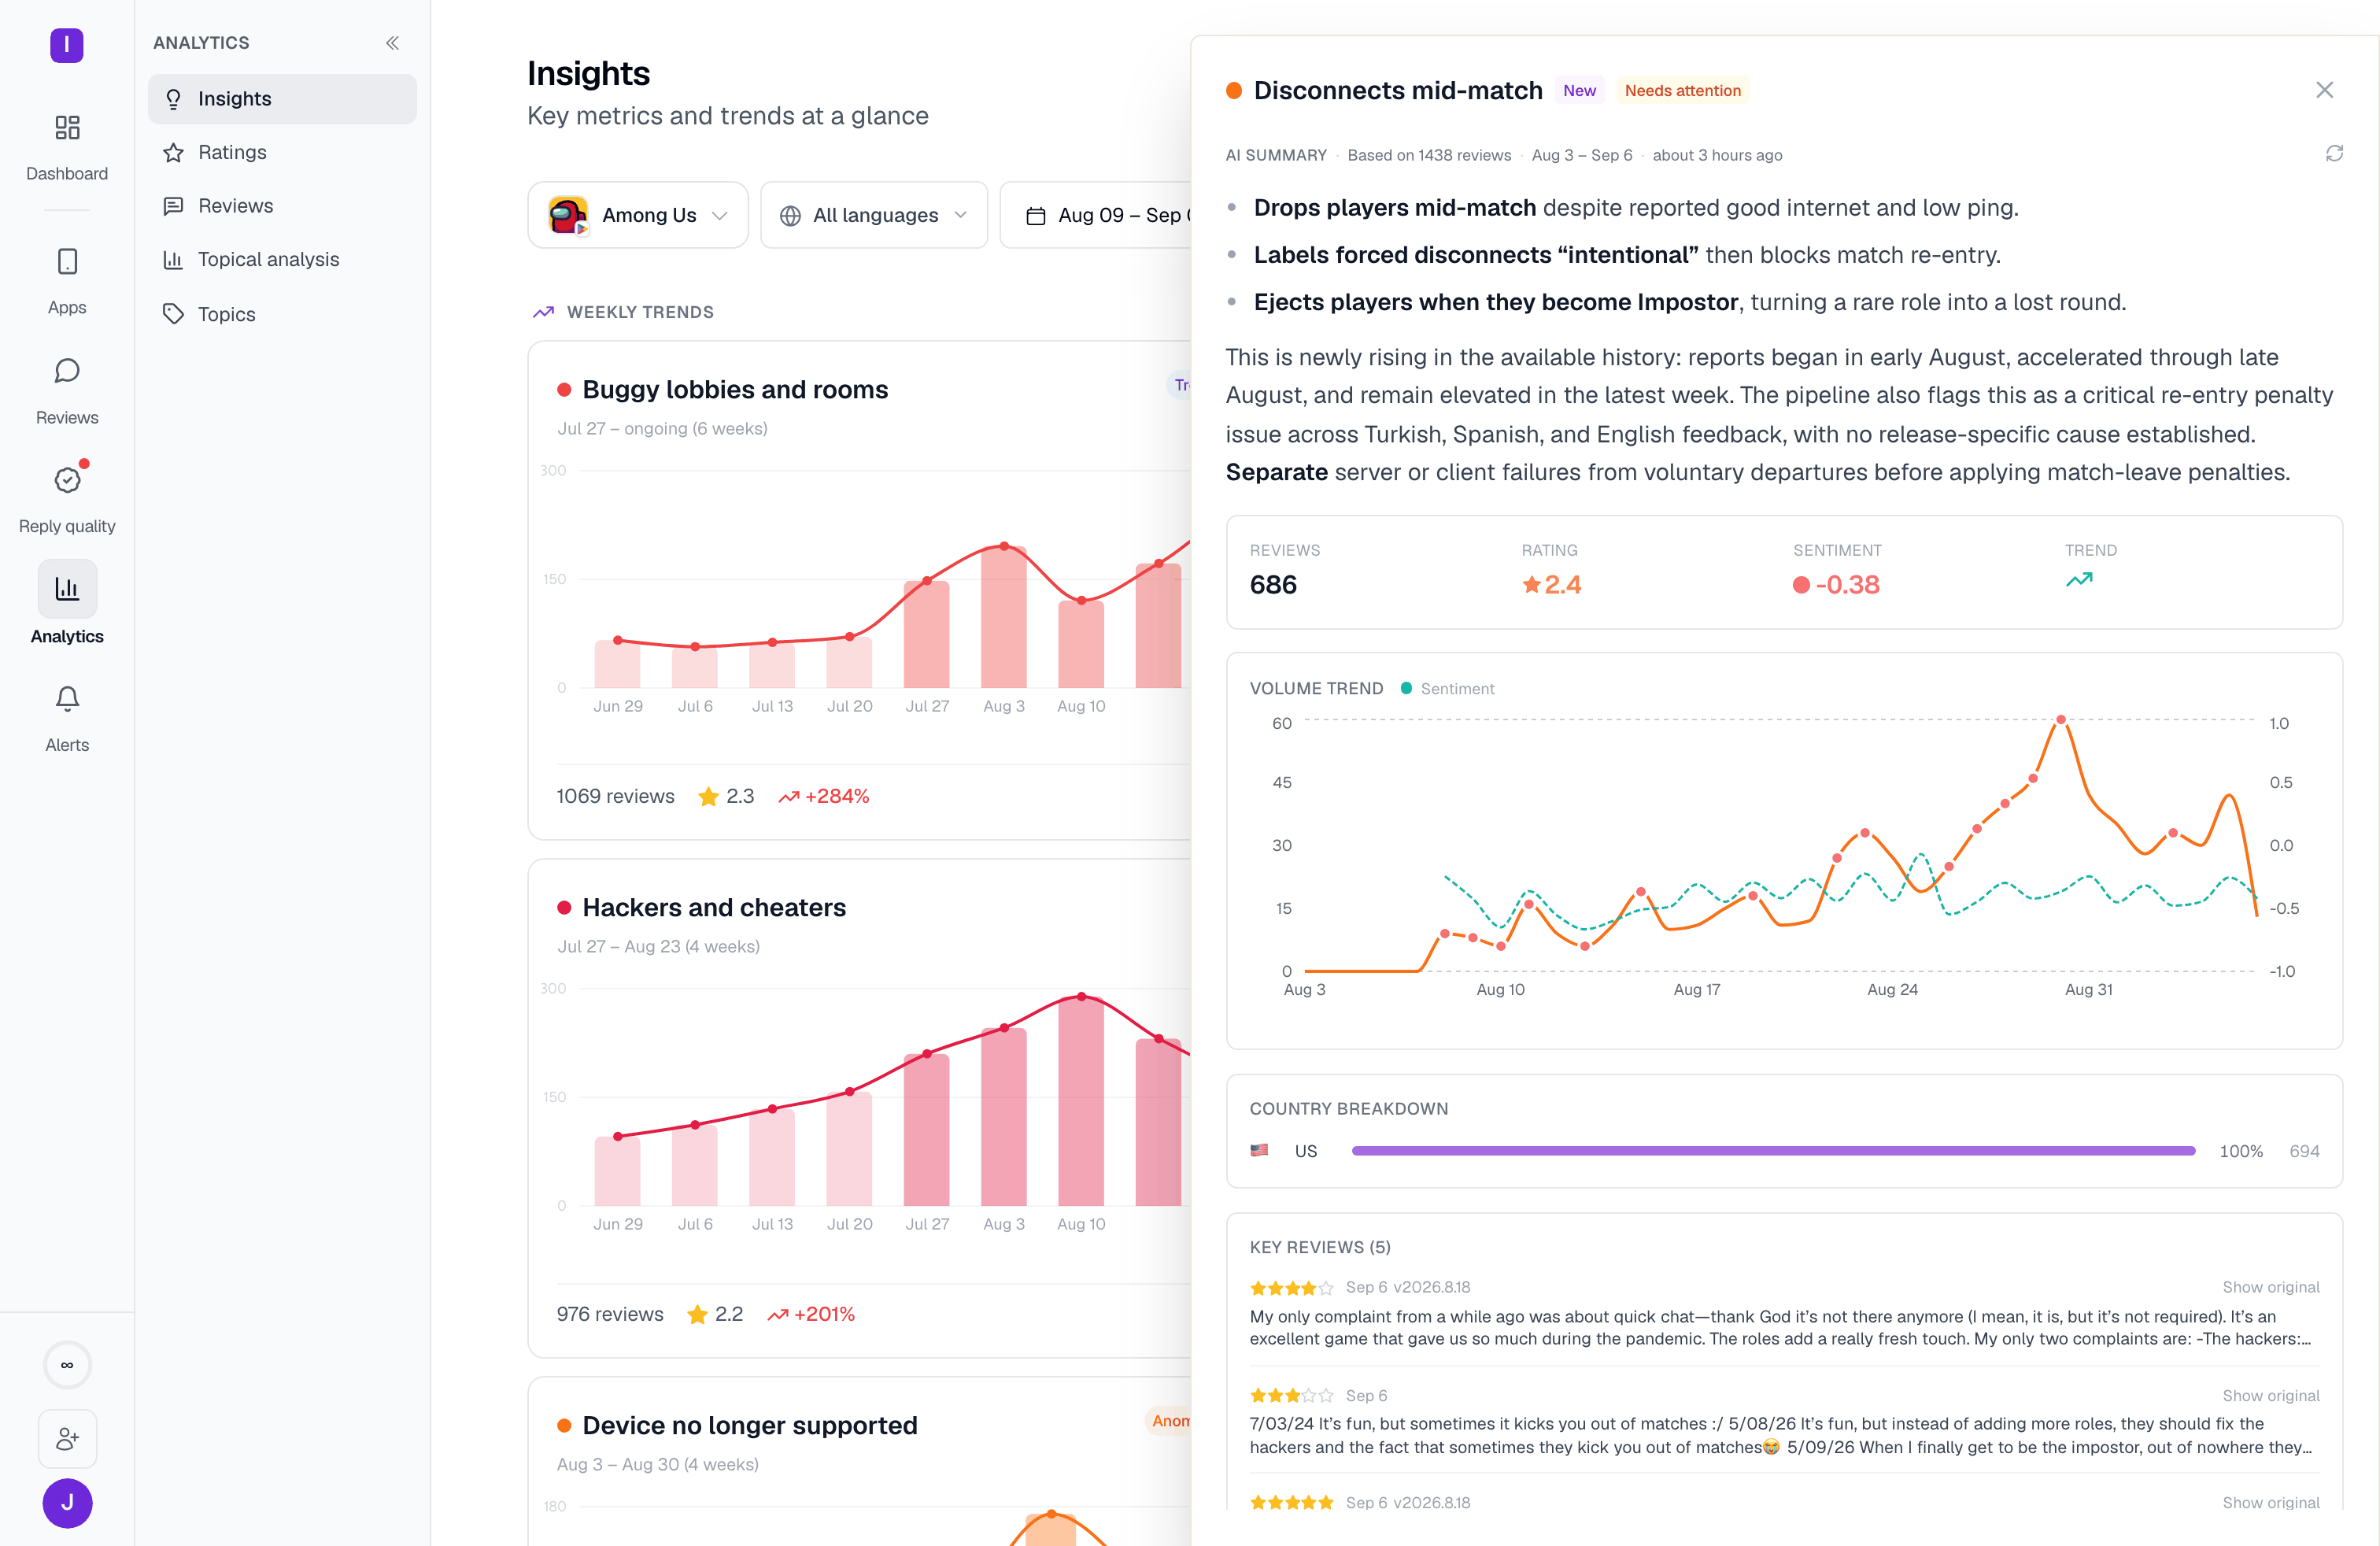 Arcs don't all run the same length or tell the same kind of story. A short-lived spike around a single update looks very different from a slow multi-week decline — the page shows both side by side, each with its own badge and lifespan.
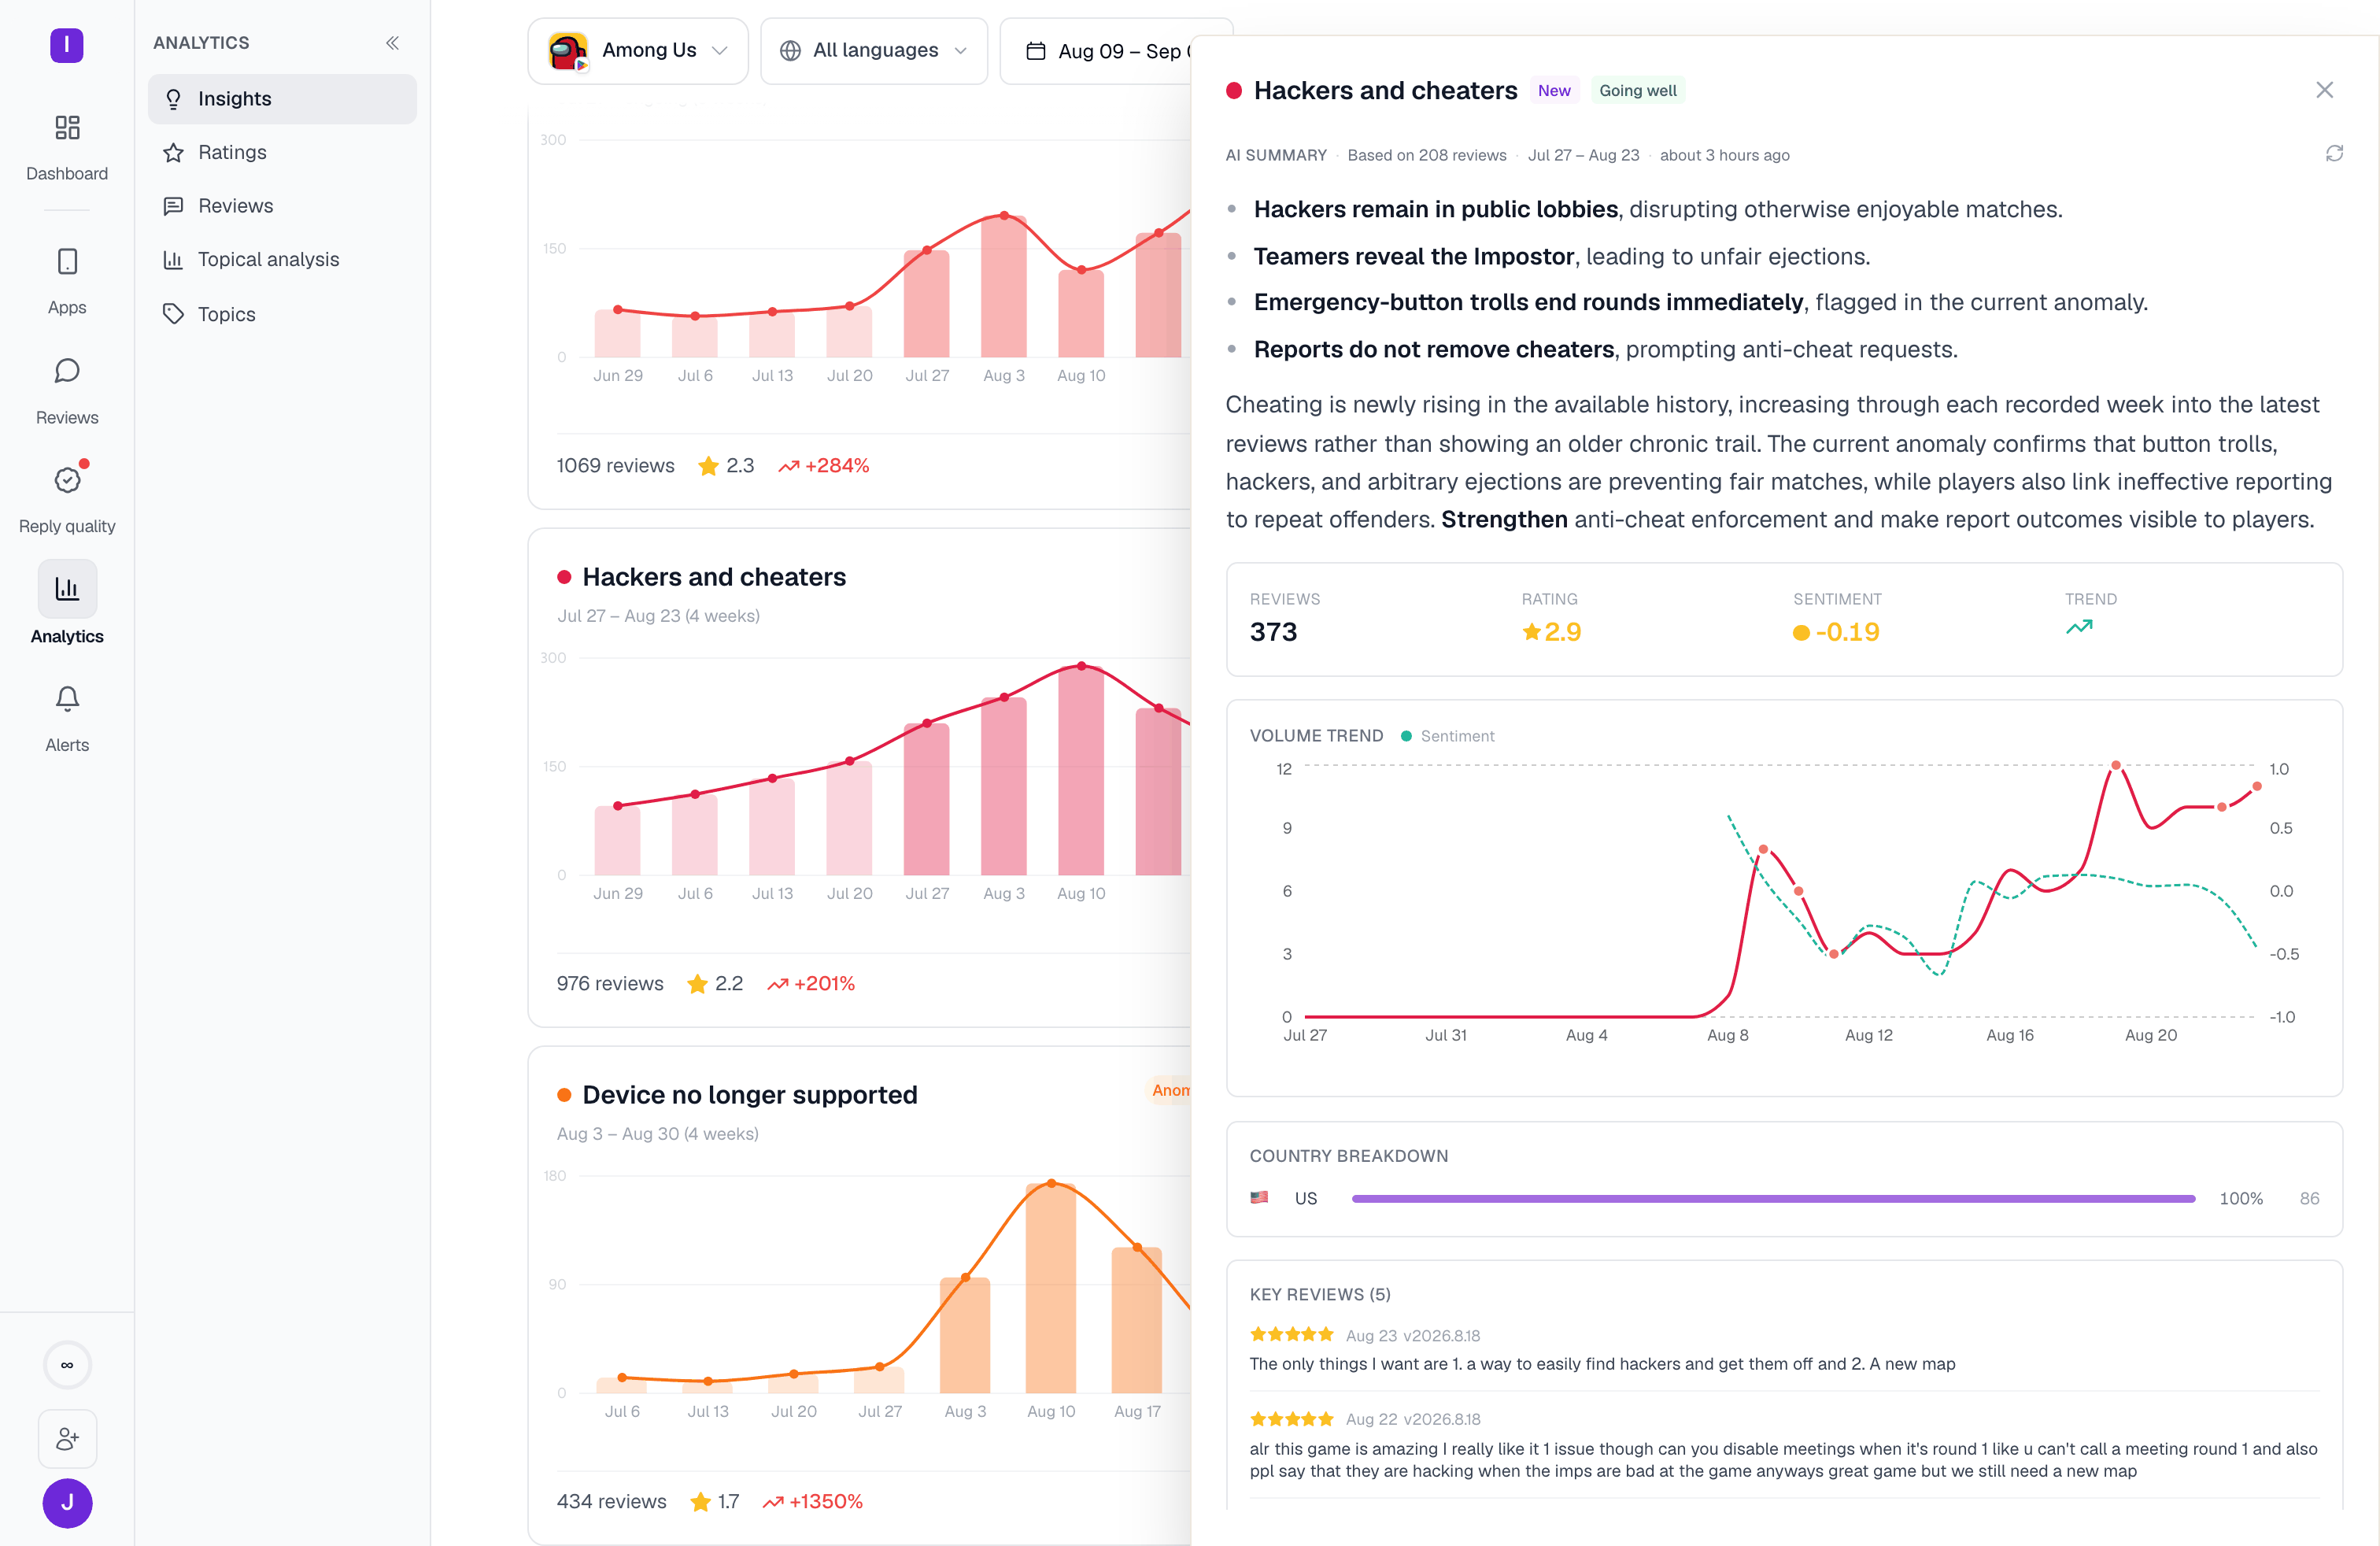 A topic can hold more than one card if it spiked, cooled off, and spiked again on a different occasion — each occurrence is its own arc with its own dates. Cards are ranked worry-first: a significant, negative, longer-running arc outranks a shorter or positive one, so the grid opens with what needs your attention rather than what's most recent.
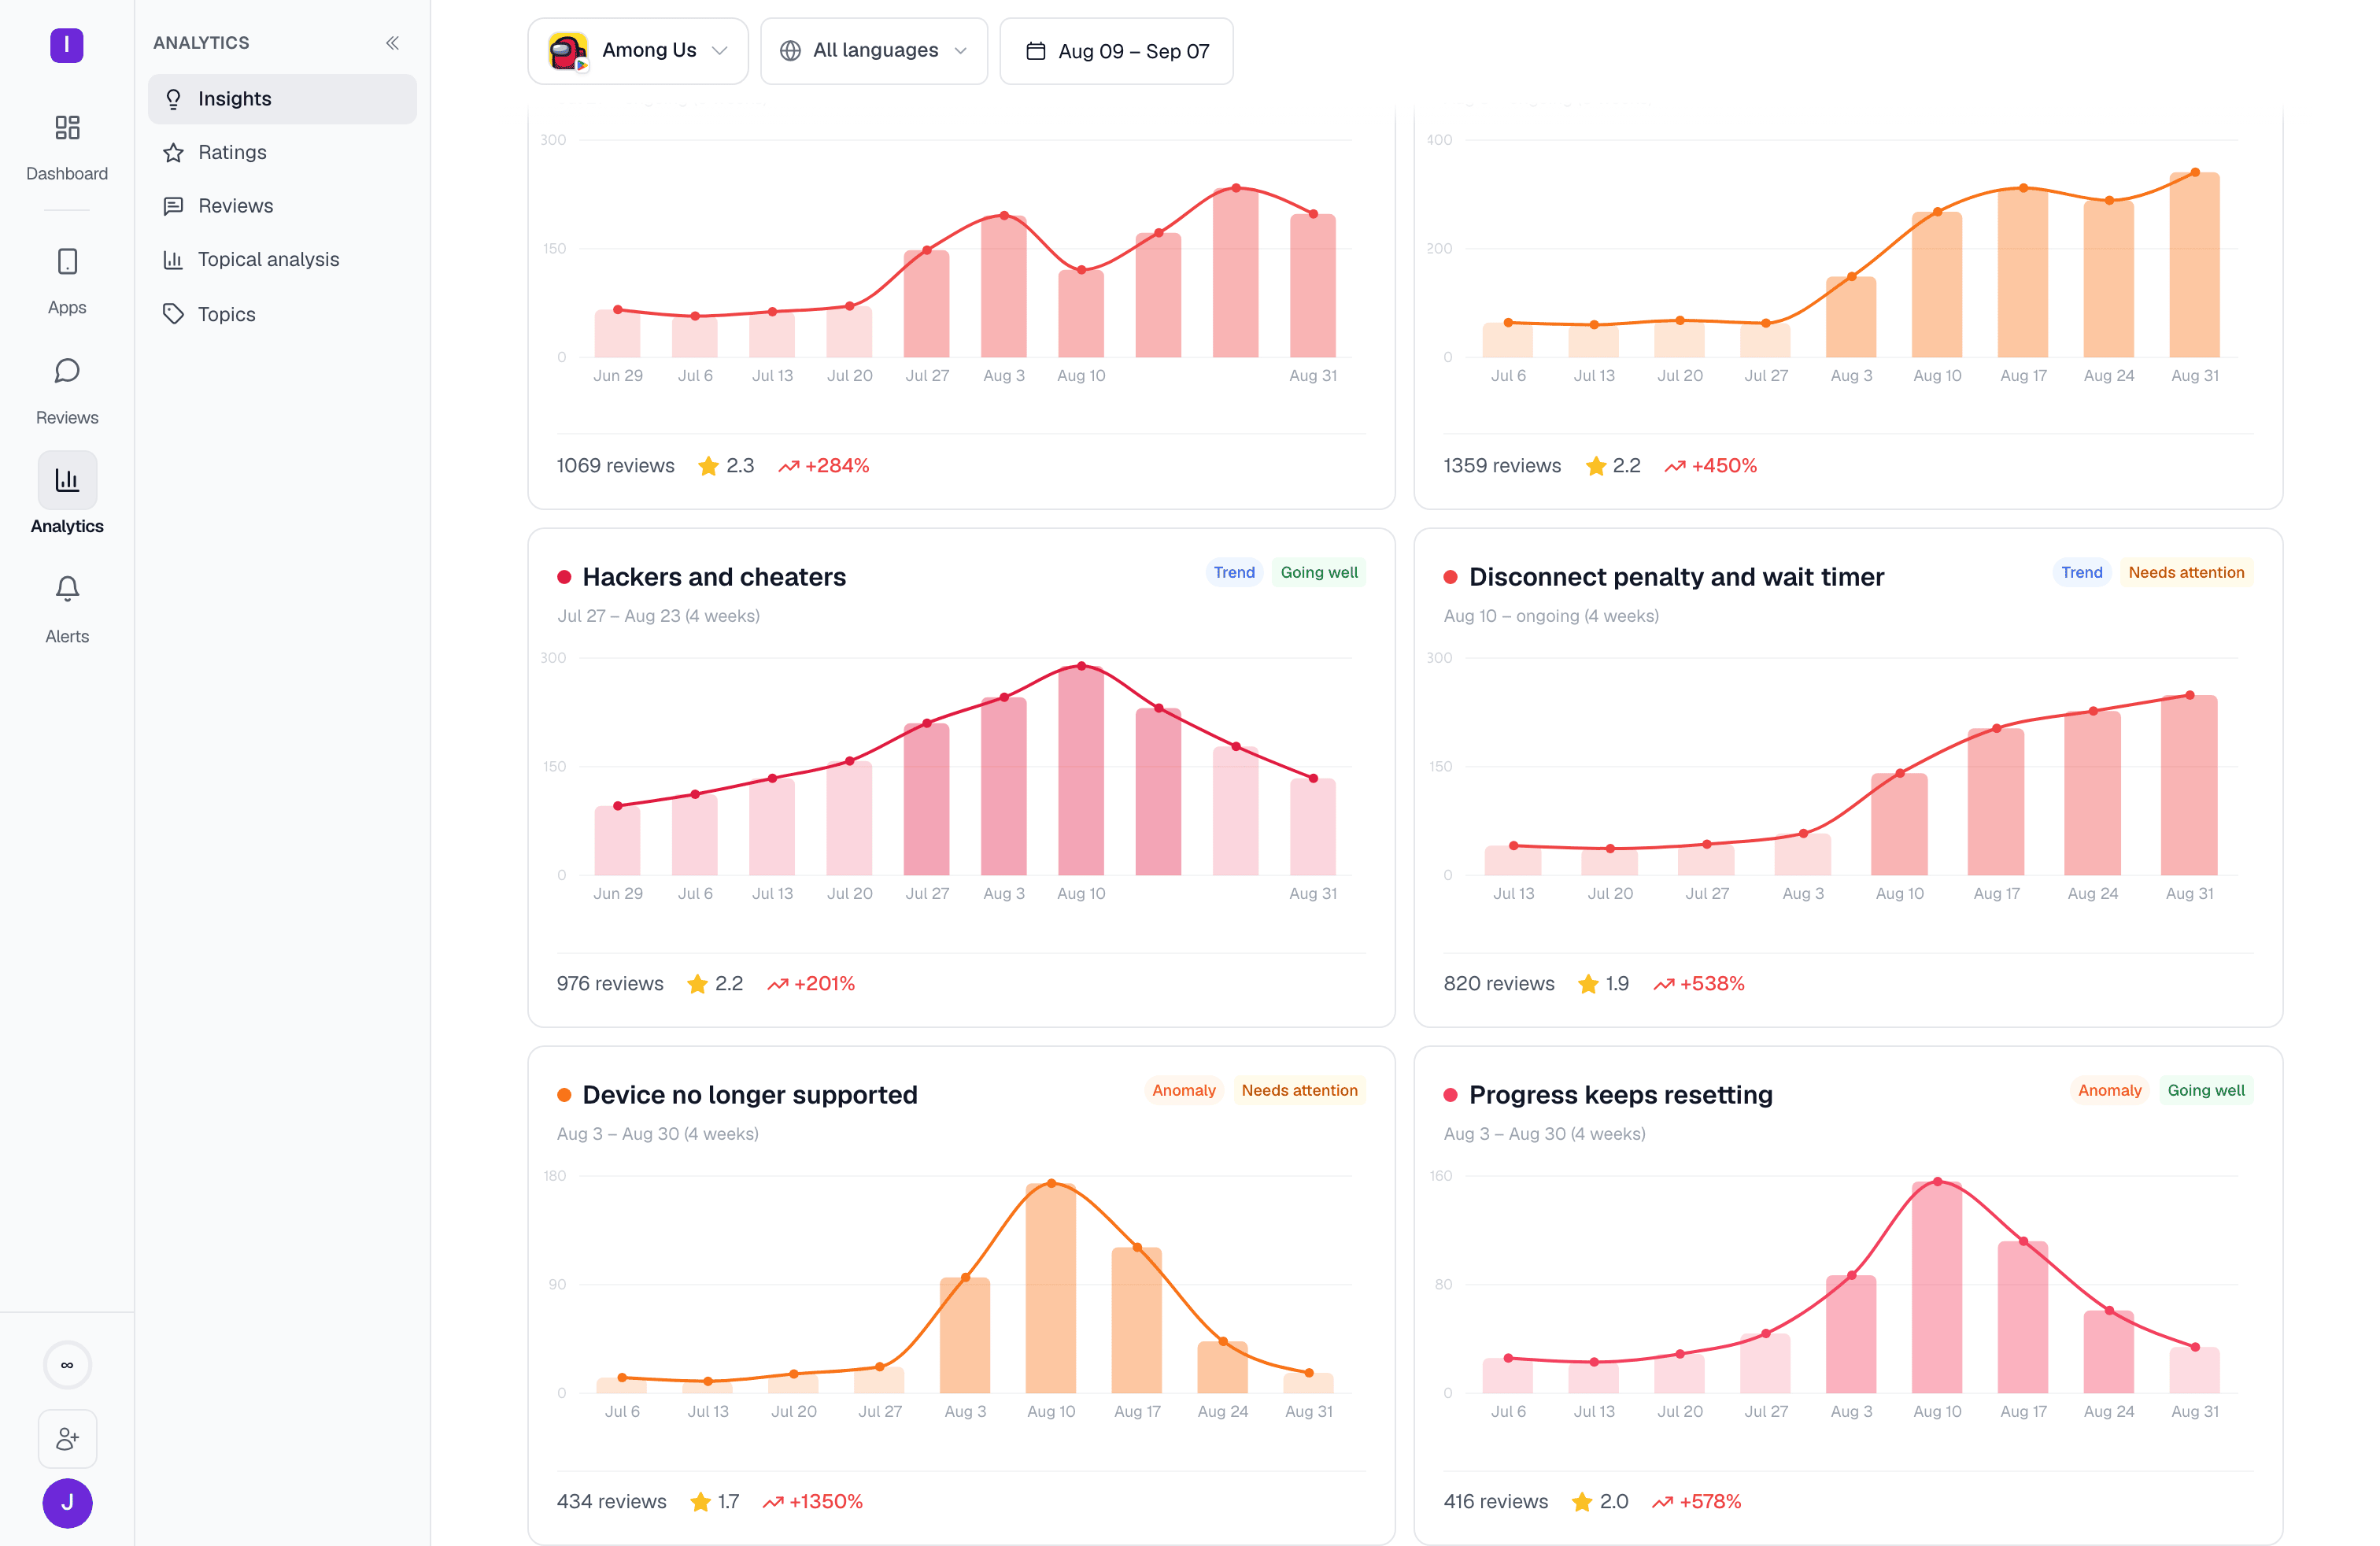 A window this short can't see a weekly arc on its own — arcs are stitched from completed weeks, and a 7-day window spans at most one finished week. To keep a genuinely current story from disappearing on a short window, Insights also looks back up to two weeks before the picker's start when selecting which arcs to show. Every card still prints its own real dates, so you can always see when an arc actually happened.
## Topic discovery and cold-start apps
A topic needs enough classified review history before it can form an arc. If your app doesn't have topics set up yet and has more than about 20 new reviews in the window, Insights shows a **Discover Topics** prompt instead of the arc grid. This kicks off classification — an initial "bootstrap" pass that tags your existing reviews — with a progress bar and a cancel option while it runs.
Once topics exist but there isn't yet enough weekly history to form arcs, the page falls back to a simpler **trending topics** view: the most notable topics from your most recent data, without the week-over-week story. This is a stepping stone — as more weeks of history accumulate, the weekly arc view takes over automatically.
## Multi-app scope
Selecting several apps in the filter bar switches Insights from one arc grid to one **per app**, each under its own app header. Cards are capped at four per app, so a portfolio of apps stays scannable without burying the second and third app below the fold. Clicking a card in this view opens the same drilldown, scoped to that app, with the same **Open in Reviews** link.
How the shared filter bar and plan gating work across all of Analytics
Explore every topic directly, outside the weekly arc model
A window this short can't see a weekly arc on its own — arcs are stitched from completed weeks, and a 7-day window spans at most one finished week. To keep a genuinely current story from disappearing on a short window, Insights also looks back up to two weeks before the picker's start when selecting which arcs to show. Every card still prints its own real dates, so you can always see when an arc actually happened.
## Topic discovery and cold-start apps
A topic needs enough classified review history before it can form an arc. If your app doesn't have topics set up yet and has more than about 20 new reviews in the window, Insights shows a **Discover Topics** prompt instead of the arc grid. This kicks off classification — an initial "bootstrap" pass that tags your existing reviews — with a progress bar and a cancel option while it runs.
Once topics exist but there isn't yet enough weekly history to form arcs, the page falls back to a simpler **trending topics** view: the most notable topics from your most recent data, without the week-over-week story. This is a stepping stone — as more weeks of history accumulate, the weekly arc view takes over automatically.
## Multi-app scope
Selecting several apps in the filter bar switches Insights from one arc grid to one **per app**, each under its own app header. Cards are capped at four per app, so a portfolio of apps stays scannable without burying the second and third app below the fold. Clicking a card in this view opens the same drilldown, scoped to that app, with the same **Open in Reviews** link.
How the shared filter bar and plan gating work across all of Analytics
Explore every topic directly, outside the weekly arc model